OSI Systems (OSIS)
Heightened demand for cargo security scanning products propelling strong growth
OSI Systems OSIS 0.00%↑ designs and manufactures specialized electronic systems and components. Their work is vital across a few key sectors—ensuring public safety through security screening, supporting healthcare through patient monitoring, and contributing to defense and aerospace with advanced technology.
OSI has three segments and is known for their largest segments, the security division, which is at the forefront of keeping us safe. Think of all the places where security is non-negotiable: airports, borders, government buildings. OSI provides the scanners and systems that scrutinize everything from luggage to cargo, making sure threats don’t slip through. OSI’s security offerings are differentiated through its cargo scanning products that are used at borders for more seamless trade between countries.
The healthcare segment focuses on patient monitoring through sensor products such as electrocardiographs. Then there's the Optoelectronics and Manufacturing business that creates tiny but powerful parts that go into all sorts of devices for sensing light in industrial settings. In essence, optoelectronics and the two other segments all leverage the same technology, with optoelectronics making the small technology tools that go into their healthcare and security products, and products of many other industries by serving outside customers in addition to internal customers.
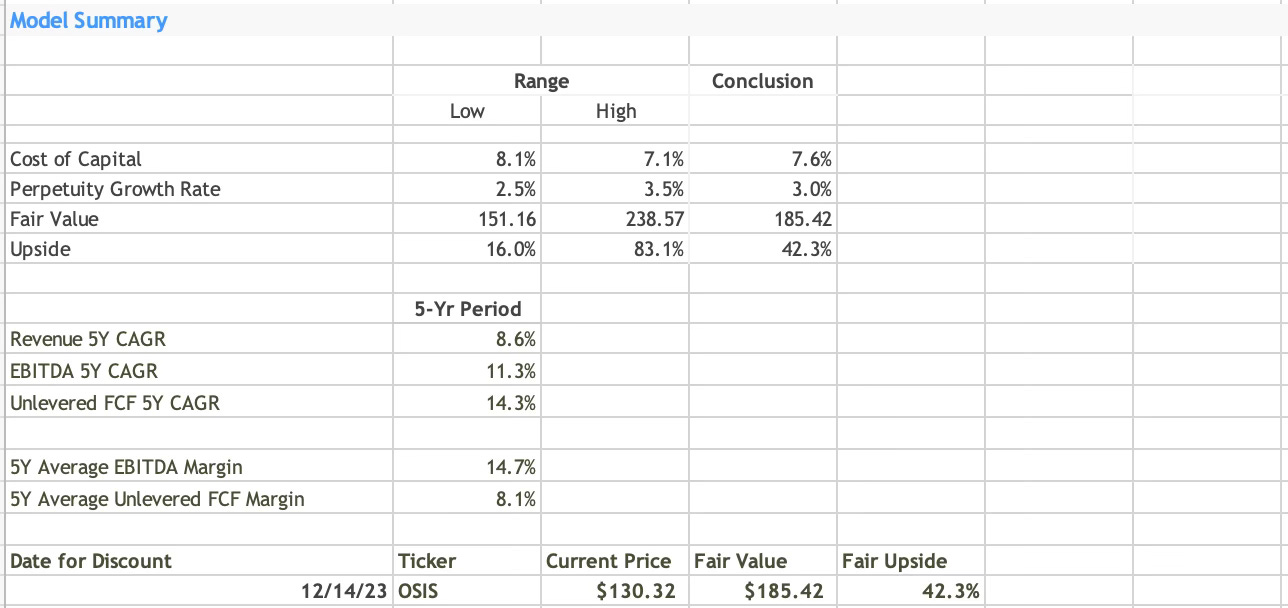
The investment rationale for OSI is a continued need for security products and an increasing need for cargo scanning products in a world that’s increasingly connected economically. OSI has landed some large contracts in the past two years and has a backlog that’s at its highest level ever, driven by strong book-to-bill ratios. Revenue is expected to accelerate in calendar 2023 and I view shares as undervalued with a fair value estimate of $185, which is 42% above the current stock price.
The rest of this analysis will cover OSI Systems by providing an overview of the business and the industry dynamics followed by an examination of the capital allocation history, management and their incentives, capped with an outlook and valuation.
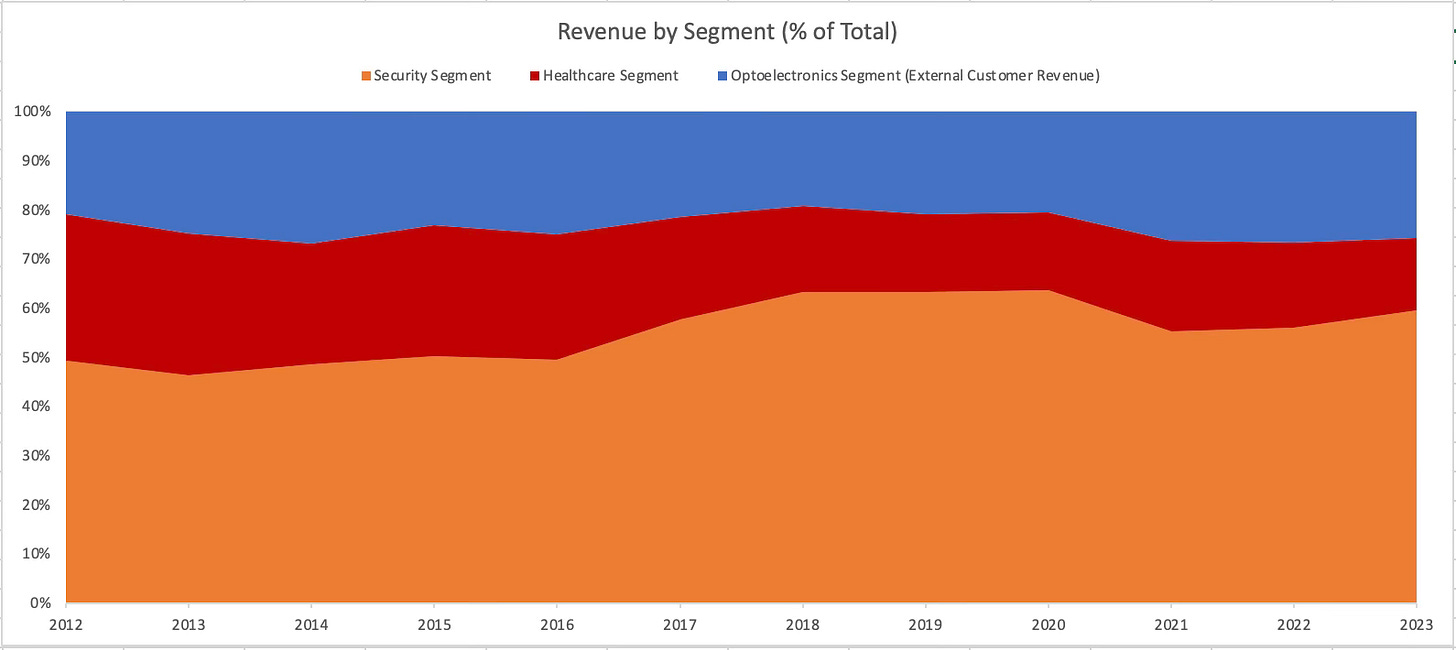
Business overview: The largest segment for OSI systems is the security segment which made up 59.5% of company-wide revenue in fiscal 2023 (ended June 30, 2023). The security division plays a pivotal role in the global landscape of security and inspection, a market that has become increasingly vital in today's world. This segment underscores the critical nature of security in various sectors and OSI has a substantial presence in the field.
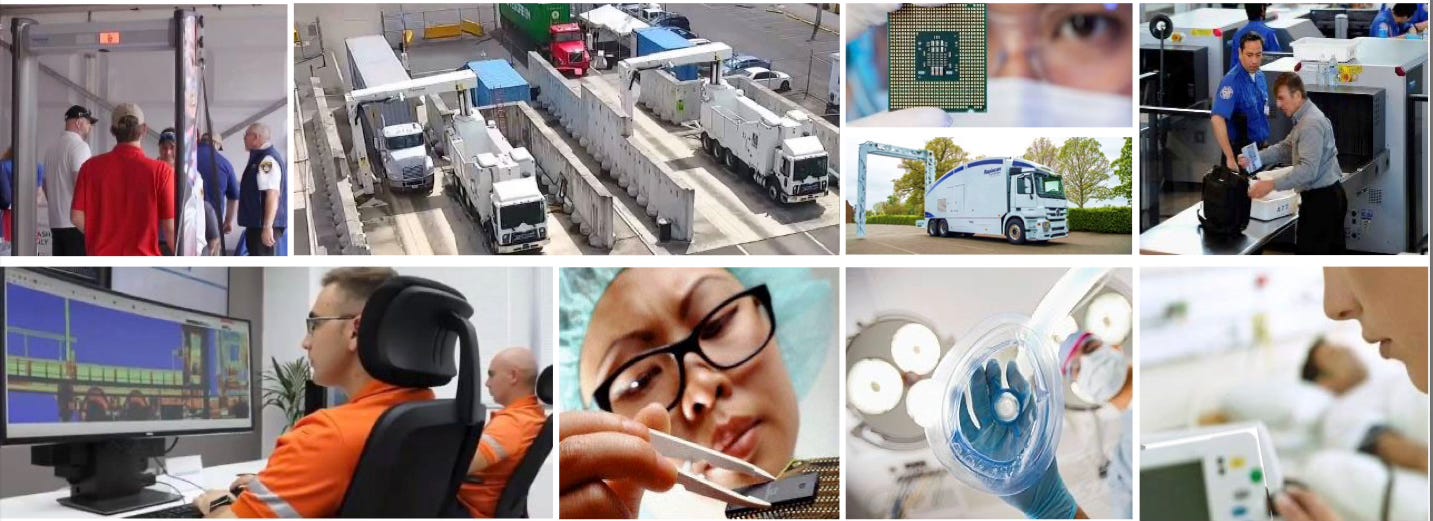
The security and inspection market is driven by a wide range of technologies, including X-ray, computed tomography, metal detection, and radiation monitoring, among others. OSI, primarily operating under the "Rapiscan" trade name, has positioned itself as a key player in this industry. The demand for such products is fueled by ongoing concerns over terrorism, drug and human trafficking, gun violence, and the need for stringent government security regulations globally. OSI's products find their applications not just in airports, but also in border crossings, seaports, correctional facilities, government and military installations, and at major sporting and cultural events. OSI’s Rapiscan will be the primary security detection provider of the 2024 Olympics in France, and was also the leading security provider for the FIFA World Cup in Qatar and London Olympics in 2012, all of which help build brand recognition.
OSI's security products are diverse, ranging from baggage and parcel inspection to sophisticated systems for scanning cargo, vehicles, and even people. The technology employed is state-of-the-art, including dual-energy X-ray imaging and advanced algorithms, enhancing the detection of contraband such as explosives, weapons, and narcotics. The company's ability to adapt its systems to changing customer requirements and regulatory standards is a testament to its commitment to innovation.
The Security division's products vary in scale from compact, handheld devices to large systems capable of inspecting shipping containers and trucks. These systems employ a combination of transmission imaging and backscatter imaging, the latter being a technique that detects X-rays scattered back towards the source, effectively revealing objects on or near the surface being scanned. OSI has also developed specific technologies in some cases to meet the unique security requirements of government customers.
The customer base for these products is extensive and includes numerous U.S. government departments, as well as international government agencies and private sector clients. This wide-ranging clientele reflects the universal need for security across different sectors and geographies. OSI's ability to offer tailored solutions, complying with various international performance standards, sets it apart in the marketplace.
One of OSI's notable strengths is its ability to provide turnkey security solutions. This includes not just the supply of equipment but also the construction, staffing, and operation of security screening facilities. Such comprehensive service offerings ensure that OSI can meet the diverse and evolving needs of its clients. Turnkey projects also allow for bigger installed bases with more services, and lead to more success for the customer and higher margins for OSI.
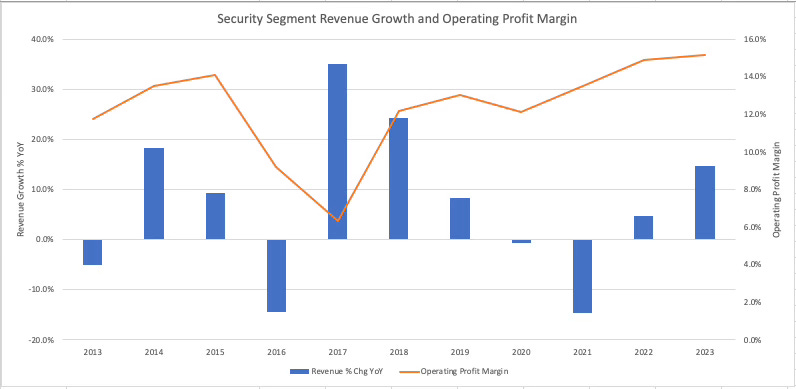
The security segment has increased its revenue from $372.2M in 2013 to $760.3M in 2023 for a compounded annual growth rate (“CAGR”) of 7.4%. Over that period, there have been two years with significant drops in revenue. The first was 2016 when a large government contract lapsed, pulling down the growth that year. The other was in fiscal 2021 when the aviation and cargo business was impacted by COVID-19 with customers pushing out delivery of orders. Relative to the other segments, operating profit margins have been healthy by averaging about 12% since 2012. In addition, operating profit has grown at a faster clip than revenue increasing from $43.7M in 2013 to $115.0M in 2023 for a CAGR rate of 10.1%.
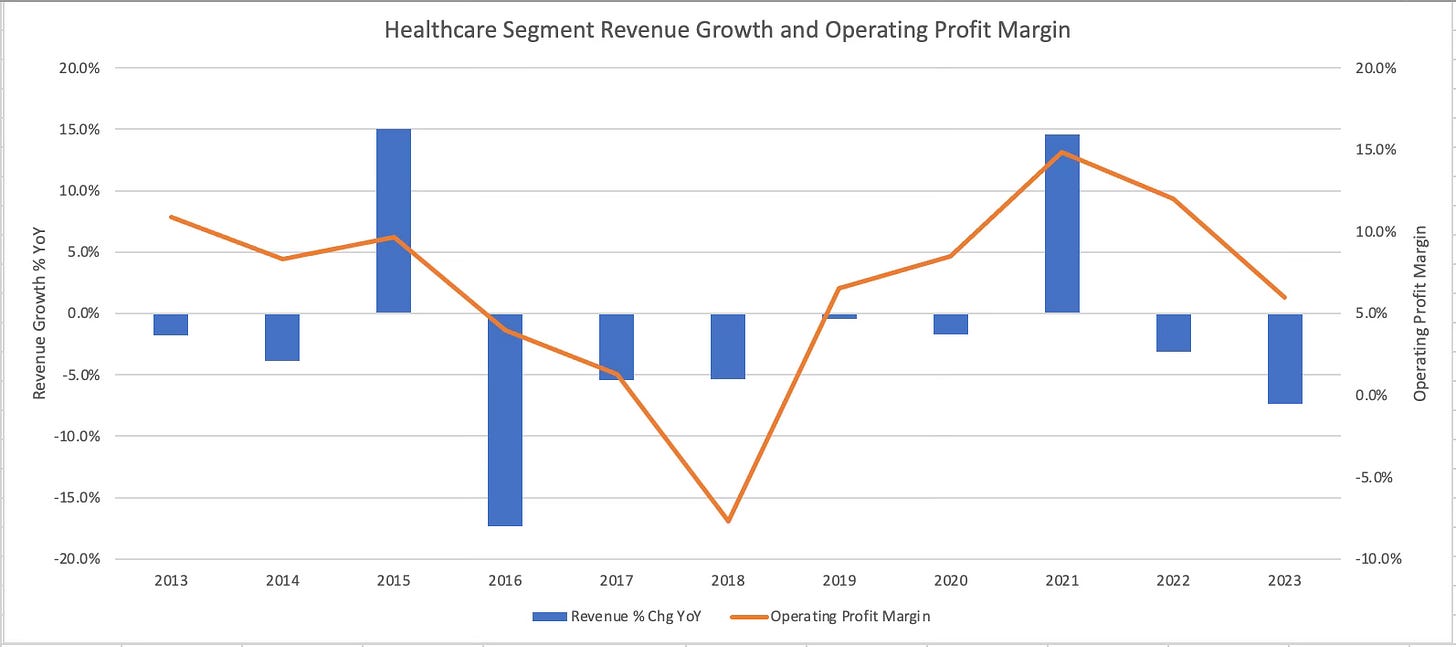
OSI Systems' Healthcare segment, under the Spacelabs banner, accounts for a modest 14.9% of the company's revenue as of 2023, making it the smallest slice of OSI's business pie. The segment's presence in the healthcare market is propelled by growth in global healthcare needs, fueled by demographic trends and technological integration. However, this is a narrative of struggle more than success, with a CAGR of -1.9% over the past decade.
Spacelabs has a deep history as it was founded in 1958 by a pair of scientists who developed cardiac monitoring systems for NASA. Their products were then used for wireless monitoring for vitals for astronauts in Gemini and Apollo missions. According to the company’s website, Neil Armstrong stepped onto the moon wearing Spacelabs telemetry (EKG/heart monitoring). Now that we’re decades past those early pioneer days, results have been underwhelming.
While the healthcare industry burgeons, propelled by expanding middle classes in developing regions and the silver wave of aging populations in more developed nations, OSI's Healthcare division appears to be in a bit of an operational malaise. The segment's offerings—patient monitoring systems, cardiology, remote monitoring, and connected care solutions—are amid a highly competitive market where innovation is relentless, and customer loyalty is hard-won. The demands of the sector have escalated, with providers being pushed to deliver more value with less overhead, a challenge compounded by the regulatory rigmarole and economic uncertainty, particularly within the U.S. healthcare landscape.
OSI's foray into the healthcare tech market with Spacelabs products aims to meet these challenges head-on. However, there's an undercurrent that perhaps their offerings may not be entirely in step with the cutting edge of medical technology. While they tout patient monitors and systems like Xprezzon and Qube, and highlight the SafeNSound platform for its workflow and communication efficiencies, I wonder if these solutions are truly differentiating themselves in a crowded field or if they're losing their footing compared to more agile competitors who are quicker to integrate the latest in medical tech innovations.
Their predictive analytics and clinical decision support tools, including the FDA-cleared Rothman Index, suggest a stride towards modernization, but there's a suggestion that such advancements might not be enough to outpace the competition or fully meet the shifting demands of healthcare providers.
In cardiology, OSI's digital telemetry systems and ECG management tools like PathfinderSL and Lifescreen™ Pro aim to streamline and enhance cardiac care. Yet, the concern lingers—do these products offer anything that can't be found elsewhere, perhaps with more sophisticated features or at a better price point?
The market for OSI's healthcare products is broad, spanning hospitals, clinics, and surgery centers worldwide, with efforts to penetrate markets through direct sales and networks like the NHS Supplies Organisation and UGAP in France. But despite this reach, the numbers tell a tale of a segment not quite hitting its stride.
Financially, this segment has been the weakest over the past decade. Revenue has gone from $231.3M in 2013 to $190.5M in 2023 and there’s not been any material divestitures artificially pulling that down. (As noted CAGR of -1.9%.) The average operating margin since 2013 of 7% also lags the other segments. OSI does segment reporting of operating profit, depreciation and amortization (to arrive at EBITDA), segment assets and CapEx. While they don’t give gross profit, the 10-K states healthcare has had the highest gross margin of the three segments. Recall the difference between gross profit and operating profit is selling general & admin expenses and R&D expenses, so those two line items must be notably higher for healthcare on a relative basis. Operating profit of $25.2M (10.9% margin) in 2013 fell to $11.4M (6.0% margin) in 2023. Outside of a couple strong years in 2021 and 2022 amid higher demand during covid, operating margins have generally fallen over the last decade.
The third and final segment is the optoelectronics and manufacturing division, which made up 25.6% of company-wide revenue and has had a healthy growth trajectory over the past decade. The products and services under OSI's Optoelectronics banner range from active components, like those sensing light for conversion into electrical signals, to passive components that manage light without altering its energy. These components are crucial in applications like medical diagnostics, satellite navigation, and homeland security. Some examples of end markets include components in satellite navigation systems for aerospace, laser-guided munitions systems within the defense industry, laser-based remote sensing devices for classifying vehicles for traffic management and industrial automation. The customers for the optoelectronics are quite diverse spanning consumer and industrial industries. CEO Deepak Chopra made this comment in the October 2023 earnings call:
“[Optoelectronics has] a very predictable customer base. We work with the OEMs, and we continue to look at it…The thing that really makes us very, very good compared to our competitors, one is, we've got a very broad customer base from aerospace, defense, to automotive, medical, consumer, name it, we're in all spaces.
"So as a group, all those areas, some are weak, some are strong. And the second thing that we keep saying it, and I've said it before, and I said it again, our global presence of manufacturing is a big advantage. And lately, you've heard it everywhere that there's a lot of talk about alternate to China. And we have the ability, both in Asia and in U.S. and in Europe to manufacture products from our customers. So we look at this business as a very well thought out business, predictable business.”
The company provides a full suite of manufacturing services, including printed circuit board assembly and box-build manufacturing. Their reach in manufacturing extends to providing components that bolster the security and healthcare segments of OSI, indicating an integrated approach to their business model.
The Optoelectronics segment has ridden the wave of technological progress, where cheaper and more powerful computing capabilities have expanded the use of optoelectronic devices across a slew of industries. OSI has seized this opportunity, positioning itself as a specialized manufacturer with a broad spectrum of expertise. This specialization enables the company to meet the quick turnaround times and specific requirements of original equipment manufacturers (OEMs), catering to sectors as diverse as aerospace, defense, medical imaging, and telecommunications.
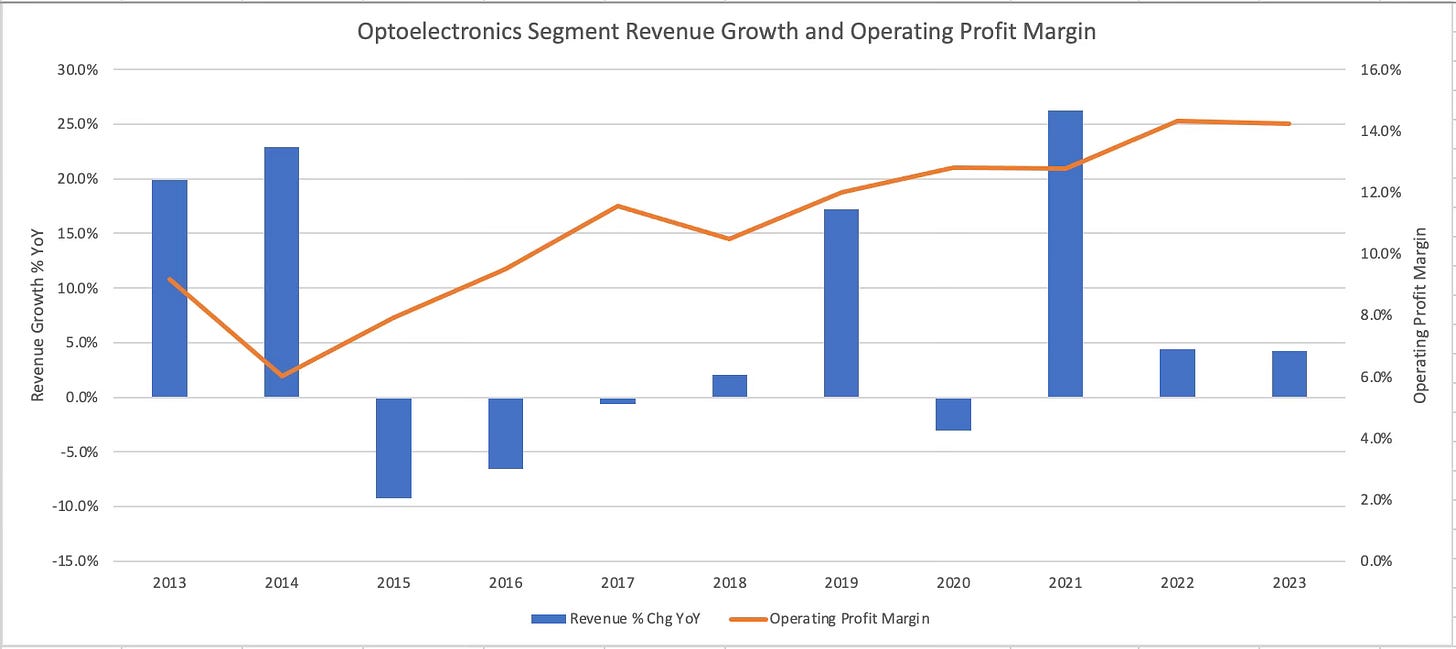
The optoelectronics segment has been a good source of growth for OSIS with revenue (from external customers) that increased from $198.5M in 2013 to $327.6M in 2023 for a CAGR rate of 5.1%, which is between the two other segments. Note that optoelectronics plays a vital role as a supplier to the security and healthcare segment by acting as a supplier for their products. As such, optoelectronics reports revenue to external customers and also intercompany revenue. For 2023, external customer revenue was $327.6M and intercompany revenue was $59.8M, making total revenue for the segment $387.4M. The intercompany revenue has generally been around 15% of the segment sales for optoelectronics. In addition, operating profit margins have also been healthy by averaging ~11% since 2013 with some margin increases in the past two years with operating profit margins in 2023 at 14.2% (operating profit divided by external customer revenue).
Below is the shift in the business mix which has gradually shifted more towards the security segment and optoelectronics, while the healthcare segment has been a shrinking piece of the pie.
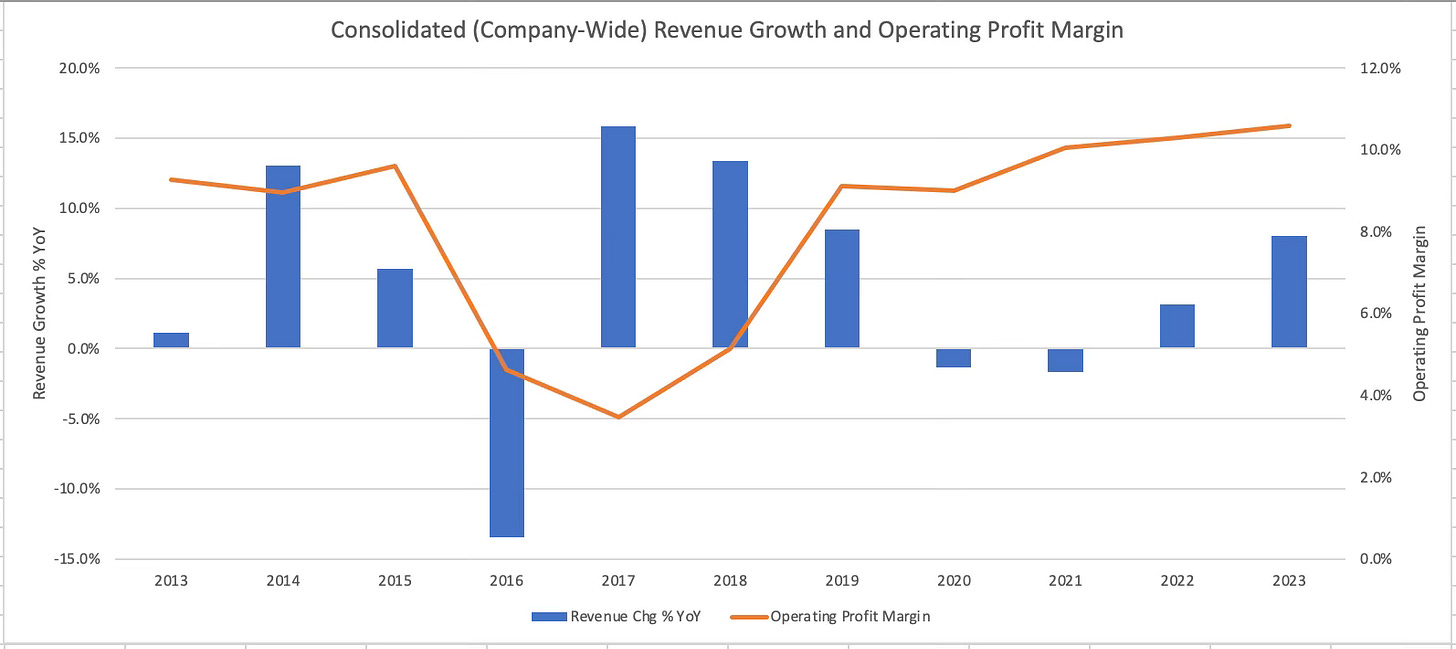
OSI as a whole has seen its revenue increase at a CAGR rate of 4.8% since 2013 while operating profit has increased at a CAGR rate of 6.2% indicating OSI has focused on profits over revenue in the past decade. The growth in the past decade is solidly lower than the prior decade years. From 2003 to 2013 OSI grew revenue at a rate of 15.9% annually when the company was more acquisitive. The healthcare and security businesses were also stronger. The similarity is that it has ebbed and flowed. After sales growth was negative in 2020 and 2021, revenue as a whole has picked up and gained momentum into 2023. Sales were up 8.0% company-wide in 2023 driven by increased sales of the cargo and vehicle inspection systems, contract manufacturing for optoelectronics, and offset by poor growth for healthcare amid tight hospital budgets.
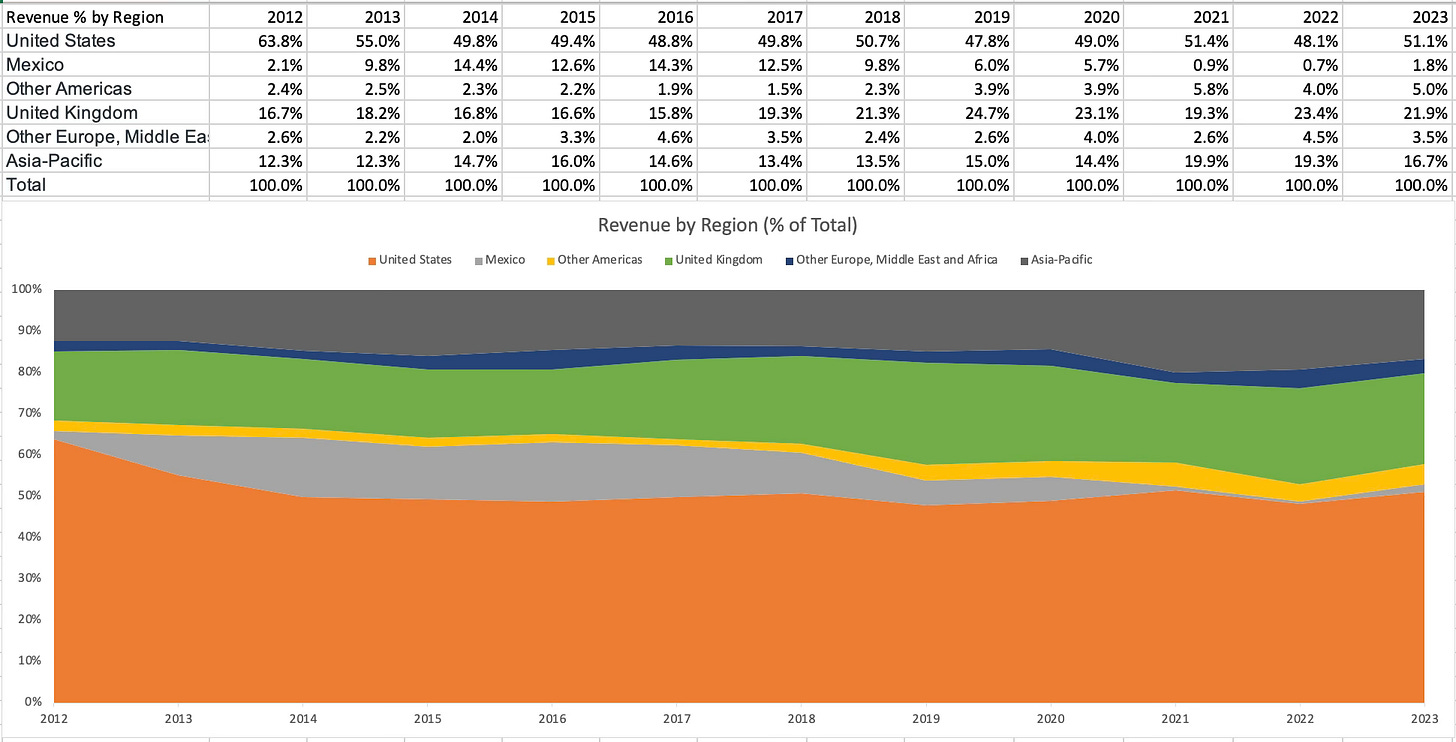
OSI Systems has a global reach with a dedicated direct sales force that is strategically positioned across the Americas, Europe, Middle East, Australia, and Asia, while an extensive network of independent distributors extends the company's reach. Support is robust, with service organizations and authorized providers located in key regions to bolster the sales process and ensure effective after-sales service. The following graphic shows the percent of revenue sourced by region. Revenue from United States has generally made up the majority of revenue but there’s been a slight decline in the past decade with modest increases from United Kingdom and Asia-Pacific.
Revenue generation from abroad had been a cause for concern for OSI, particularly in 2017 when the company was under fire by short seller Muddy Waters who alleged improper sales practices, cash payments to officials and fraud. Muddy Waters said in the report that OSI landed a contract in Albania through corruption and estimated 50% of 2017 EBITDA was from Mexico, despite generating only 15% of its revenue from Mexico through egregious pricing. OSI has been able to shake off those allegations and has even shown itself to be valuable enough to Mexico to land a $500M contract in April 2023 for cargo and vehicle inspection systems to Mexico’s Secretaría de la Defensa Nacional (SEDENA).
The company's research and development efforts are also globally distributed, with design centers in the U.S., U.K., Australia, Singapore, India, and Malaysia, focusing on advancing current product lines and exploring new applications of its technology. OSI notes that most of the labor-intensive manufacturing is done in India, Indonesia, and Malaysia. There’s also manufacturing done domestically in several states from Washington to Massachusetts. Outsourcing plays a role in their strategy, particularly for supplies, accessories, and certain manufacturing requirements like sheet metal fabrication and plastic molding.
Materials and components for OSI's products are a mix of in-house manufacturing and third-party sourcing. Despite strong relationships with single vendors for specific materials, the company maintains alternative sources to mitigate supply chain risks. However, the COVID-19 pandemic imposed challenges, affecting supply chain dynamics, labor availability, and ultimately impacting gross margins and delaying various aspects of service delivery.
Growth strategy: OSI’s growth strategy is focused on leveraging its expertise in cost effective designing and manufacturing of specialized electronic systems for critical applications. The intent is to foster profitable growth within the security, healthcare, and optoelectronics sectors while seeking new markets in which their core expertise would provide a competitive advantage. A cornerstone of OSI's growth strategy is its global reach. With multiple international locations, the company taps into competitive labor rates to reduce manufacturing costs, bolsters its sales and support network, and shortens delivery times to its global customers.
Another strategic asset for OSI is its vertical integration, which streamlines its operations by reducing times and costs, while providing a full suite of services from design to mass production. This not only sets OSI apart from competitors but also adds substantial value for customers seeking comprehensive, integrated solutions.
OSI plans to harness the growing need for advanced screening technologies due to tighter border and cargo controls. The company envisions expanding its reach by offering turnkey security solutions, including the construction and operation of screening checkpoints. Parallel to hardware, OSI anticipates the expansion of SaaS platforms that integrate data from various security sources, leveraging cloud technologies to enable remote management of security operations. Medical technology is another area where OSI is investing, aiming to improve and expand its product range to meet the evolving needs of healthcare providers and patients with user-friendly, reliable, and cost-effective solutions.
Additionally, OSI is not shy about entering new markets that align with its current tech prowess, aiming to extend its footprint through strategic internal growth and acquisitions that complement its existing product lines.
Ultimately, OSI's growth is partly fueled by its commitment to continuously refresh its product suite in response to technological advancements and market demand—a strategy underpinned by savvy R&D and the strategic acquisition of new technologies and companies to lower costs and break into new markets.
Competition: OSI Systems vies for market share with a diverse array of competitors across its varied business segments. In security and inspection, OSI rubs shoulders with industry giants like Smiths Group PLC (SMIN.L), with their Smiths Detection division, and L3Harris Technologies, Inc. (LHX), both known for their advanced security scanning technologies. Pinpointing exact market share figures for top players is challenging due to the diverse product offerings. With that said, according to third-party data, the market for security scanning products was $3.2B in 2022, meaning OSIS made up about 22% of the market, making it one of the strongest players in the industry.
As for patient monitoring, cardiology, and remote monitoring, OSI faces competition from established players like Medtronic PLC (MDT), GE Healthcare (GEHC) and Thermo Fisher Scientific (TMO). These competitors bring to the table a formidable mix of advanced technology and entrenched customer relationships. They also bring to the table quite a bit of scale and resources making it difficult for OSI to compete against.
When it comes to optoelectronic devices, OSI competes with specialized firms like Finisar Corporation (FNSR) and II-VI Incorporated (IIVI), which provide advanced optical components for various applications. OSI's niche is in delivering custom subsystems that require significant engineering expertise, setting them apart from the mass producers of standard optoelectronic components and catering to a specialized segment that values custom solutions over off-the-shelf products.
Overall there’s not perfect peers for OSI to compare against. The mutual peers, according to proxies used for compensation analysis, list Varex Imaging (VREX), Methode Electronics (MEI), Infinera (INFN), Knowles (KN), Viavi Solutions (VIAV), Lumentum (LITE) and Novanta (NOVT). Those companies range in market-cap size between ~$800M and $5.1B, which compares to OSI’s current market-cap of $2.0B. These companies primarily operate in the electronics, photonics, and communication technology sectors. While they share a technological focus with OSI, particularly in areas like optoelectronics and specialized manufacturing, they aren’t as diversified as OSI which includes security and healthcare solutions. These firms are often more specialized in their respective niches.
OSI Systems finds more similarity in Teledyne Technologies (TDY) and Leidos Holdings (LDOS), particularly when considering the breadth of their product offerings. TDY, especially post-acquisition of FLIR Systems (former FLIR), presents a compelling parallel. This merger has broadened TDY's portfolio in advanced imaging and sensor systems, resonating closely with OSI's technological footprint in security and optoelectronics. Similarly, LDOS, with its extensive involvement in defense, intelligence, and healthcare IT, mirrors aspects of OSI's diversified approach, particularly in security and healthcare technologies. Financially, both TDY and LDOS operate at a scale that’s solidly larger OSI and they sport market-caps of ~$18B and $15B, respectively. Notably, they share OSI's blend of serving government and commercial sectors, and their involvement in technology-driven markets makes them apt for a side-by-side financial comparison.
For a short overview of where Leidos Teledyne Technologies generates their revenue, I’ll start with the former. Leidos aligns its operations into three segments: Defense Solutions, Civil, and Health, collectively addressing a range of services and solutions. Their Defense Solutions segment, the largest, made up 57% of total revenues as of 2022, encompassing a broad array of technologically advanced services and products in digital modernization and C4ISR technologies (command, control, computers, communications, Intelligence, surveillance and reconnaissance). The Civil segment contributes a consistent 24%, delivering modernization and security for infrastructure systems domestically and internationally. Health, stable at 19%, focuses on affordable and effective solutions across federal and commercial health missions. The revenue distribution has remained relatively unchanged over the past three years, indicating stable segmental performance.
Teledyne, on the other hand, diversifies its offerings across four segments: Digital Imaging, Instrumentation, Aerospace and Defense Electronics, and Engineered Systems. Their growth is most prominent in the Digital Imaging sector, which has expanded from 32% in 2020 to 57% in 2022, driven by the noted FLIR acquisition. Instrumentation, though decreased to 23% in 2022, still provides a wide array of monitoring and control instruments. Aerospace and Defense Electronics, along with Engineered Systems, represent smaller, yet crucial parts of their portfolio, focusing on electronic components for commercial and defense applications and complex manufacturing solutions for various sectors.
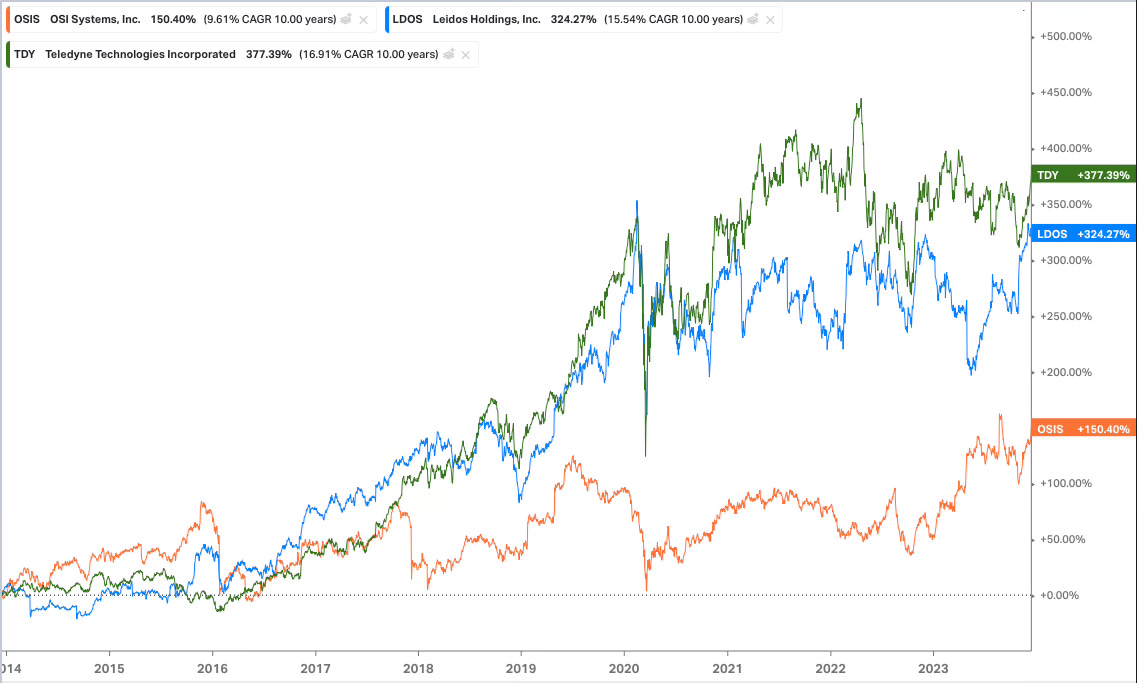
Comparing these profiles to OSI, it's evident that both Leidos and Teledyne, with their segmented structures and focus on defense, civil, and advanced technology systems, share a closer resemblance to OSI’s product and financial spectrum. Unfortunately for OSI the resemblances haven’t transferred to stock performance with a significant lag over the past 10 years. OSI shares have generated a CAGR of 9.6% compared to 15.7% for Leidos and 16.8% for Teledyne.
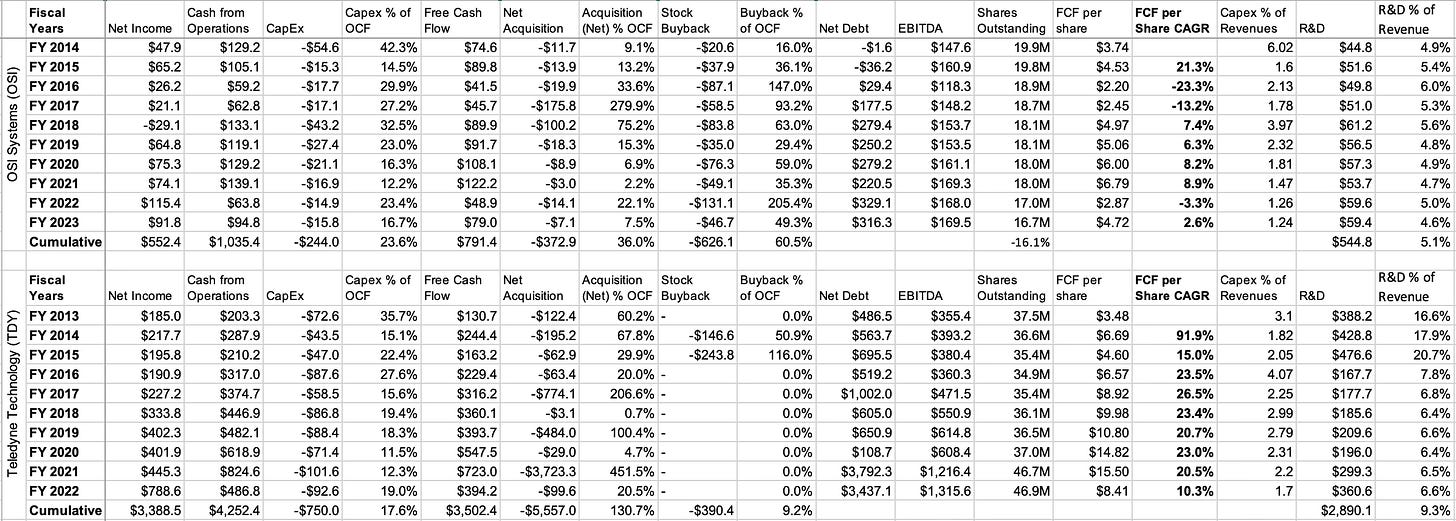
Capital Allocation: Analysis of capital allocation is a good way to figure out how management has grown free cash flow and understand how efficiently cash flows were spent. OSI can invest back into the business through R&D and CapEx, build through M&A, buyback shares or give back capital through dividends. For this section, I’m going to use Teledyne to compare against OSI in order to provide a measuring stick.
OSI has generated operating cash flow of $1.0B in the 10 years of fiscal 2014 to fiscal 2023. $244M (23.6% of operating cash flow) was reinvested back into the company through capital expenditures. $327.9M (36.0%) was spent on acquisitions, net of divestitures, while $626M (60.5%) was spent on stock buybacks. The biggest year for buybacks was 2022, which proved timely and extended their opportunistic approach of leaning into weakness for buybacks. The 10-year period has seen shares outstanding drop by 16.1%. The largest periods of acquisitions were fiscal 2017 and 2018. In September 2016, OSI spent $266M in total consideration for American Science and Engineering (“AS&E”), a provider of cargo security detection products. The following year OSI bought the explosive trace detection (“ETD”) from Smiths Group for $80.5M. OSI issued a modest amount of stock for AS&E, and the dilution from acquisitions was negligible. Therefore it’s clear the biggest acquisition for OSI has been their own stock.
Teledyne, whose 2022 fiscal calendar ended on January 1, generated $4.25B in cash from operations. $750M (17.6% of operating cash flow) was spent on capital expenditures. However, when you add in R&D (the other form of internal investment), Teledyne’s investment back into the company is quite close to OSI on a relative basis. Where the capital allocation differs is the relative spend on buybacks and M&A. During the 10-year period, Teledyne was only active in repurchasing its shares in 2014 and 2015. The total buyback spend of $390.4M, according to the cash flow statement, is equal to 9.2% of cash from operations (which compares to 60.5% for OSI). The $5.5B in M&A spend at Teledyne is equal to 130.7% of its cash flow from operations (compared to 36.0% for OSI). Two-thirds of the M&A spend at Teledyne was all in 2021 when they purchased FLIR for total consideration of $8.1B. $3.7B was in cash, $3.9B was through the issuance of stock and the remaining $0.5B was through the assumption of debt. All told, the shares outstanding count at Teledyne increased 24.9% from 2012 to 2022 with much of it from the FLIR transaction. I’ll note that even if you remove the acquisition of FLIR, M&A spend would’ve been equal to 43% of the operating cash flow.
Despite OSI’s shares outstanding dropping meaningfully while Teledyne’s increased, the growth in free cash flow per share at OSI is a modest 2.6% CAGR compared to Teledyne’s 10.3%. FCF per share at OSI was $3.74 in 2014 and it increased to $4.72 by fiscal 2023. Teledyne started at a lower base of $3.48 and increased as high as $15.50 in 2021 before regressing to $8.41 in 2022. Excluding Teledyne's 2021 acquisition of FLIR, the two companies exhibit similar capital allocation philosophies. Where Teledyne has excelled is the operational efficiency to increase its profit margins. OSI’s operating margins have roughly been around 10% for the past 10-years. But Teledyne has increased its operating margins to 18% from about 11% over the past 10 years.
Management and incentives: OSI was founded in 1987 by Deepak Chopra who remains as CEO to this day. That’s a whopping 36 years in the role. Chopra, 72, brought OSI public in 1997 through an IPO and has spent the majority of his career with the company. Before OSI, Chopra did spend time at a few semiconductor companies.
OSI also has a seasoned CFO in Alan Edrick who joined the company in his current role in 1996. Edrick was previously CFO of biotechnology company BioSource International (formerly traded under BIOI) from 2004 to 2006 and North American Scientific from 1998 to 2004.
The third highest ranking executive is Ajay Mehra, 61, who is president of cargo scanning and solutions. Mehra is a first cousin of CEO Chopra and has been with OSI since 1989. He initially held financial roles having joined the company as controller then elevated to CFO from 1992 to 2002 until shifting to operational roles. Before OSI, Mehra was in corporate finance at consumer companies.
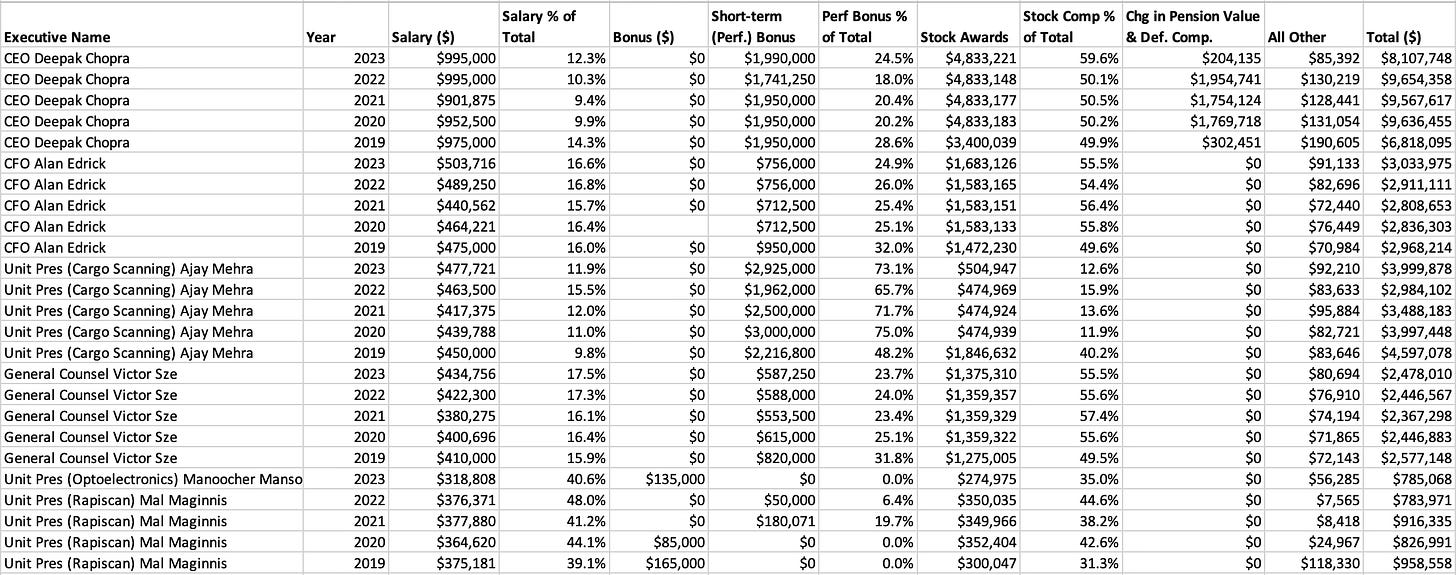
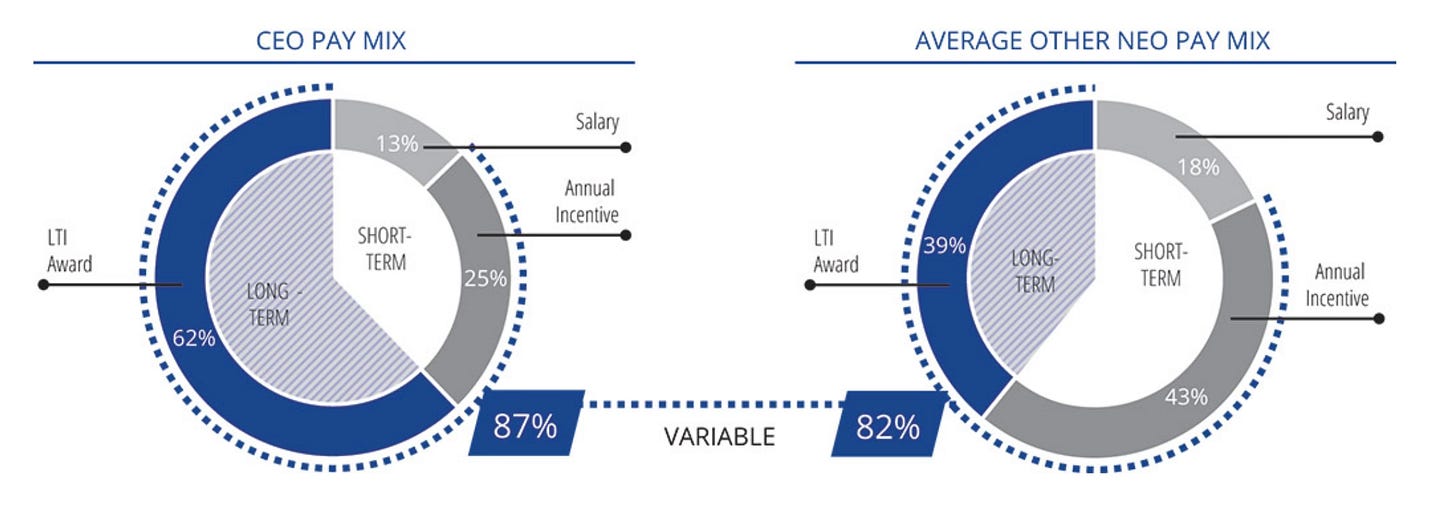
OSI has a pay mix that’s made up of salary, annual incentive bonus (often referred to as short-term incentive cash bonus) and long-time incentive pay in the form of performance-based restricted stock units (“RSUs”). Most companies call them PSUs if they vest according to performance, rather than time (which would be RSUs) but OSI calls them RSUs. The percentage breakdown of these is standard for a publicly traded company with CEO Chopra getting 13% of his total pay from salary, 25% from the annual cash bonus and 62% from the stock-based compensation. It’s peculiar and a positive data point that all of the stock-based compensation is in the form of performance-based RSUs, which contrasts with the norm of using a mix of both.
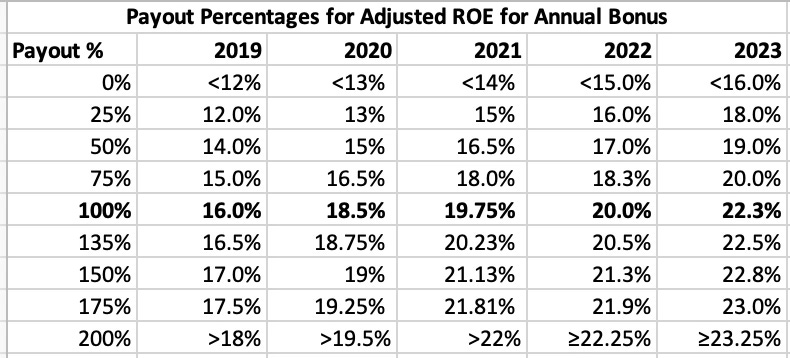
The target size of the annual bonus is 100% for each of the named executives and the max amount is 200% of Chopra’s salary and 150% Edrick. The incentive that decides the payout amount is adjusted return on equity (“ROE”). OSI doesn’t disclose in the proxy what is their difference of adjusted ROE from the standard calculation of net income divided by average shareholder equity. The target amount for 2023 was 22.25%, an increase from 20% in the prior year. As you can see in the table below, there’s been a steady trend of making the hurdle higher for the bonus to be paid in full. Assuming an honest and consistent calculation of adjusted ROE, it’s a good metric for an annual bonus. It also incentivizes management to execute buybacks which brings down the shareholder equity (the denominator in the formula). I’ll note that the two other named executives in 2023 — President, Cargo Ajay Mehra and President, Optoelectronics Manoocher Mansouri — have bonuses tied to the units they oversee.
The largest component of total pay at OSI is the stock-based compensation handed out to executives. As noted, the company gives out stock purely in the form of performance-based RSUs. The incentives for vesting are weighted 20% revenue and 80% EBIT CAGR over a three-year period . Generating a 4.0% CAGR revenue growth rate pays out the revenue component at 100% (which is 20% of the total) and 6% CAGR EBIT growth pays out the profit component at 100% (which is 80% of the total). Management can get additional payouts for generating higher growth. Knowing that the weighting is 80% EBIT growth and 20% revenue growth it isn’t a surprise that profits have grown at a faster clip than revenue over the past decade+.
I find the compensation incentives to be quite strong at OSIS overall. The rise in adjusted ROE threshold, pure use of performance RSUs, and the 20%/80% weighting of revenue and EBIT growth for stock incentives are all positive attributes. My only issue is I’d like to see the compensation committee raise the thresholds for revenue and EBIT growth to incentivize greater growth.
Outlook: There’s a growing need for security in a world that’s increasingly connected economically, which will provide a meaningful tailwind to OSI, particularly for the cargo business that has been driving growth beyond airport security. Airport security, however, gets much more attention. Geopolitical events such as the war in Ukraine and conflicts in the Middle East do generate additional revenue for OSI. This isn’t a geopolitical newsletter so I’m going to refrain from discussing where the world is going, but there’s surely an ongoing need for security products. And there’s even more reason for facilities to revamp security offerings given the improvement in technology that can be applied to threat detection. OSI has previously touted its algorithms for threat detection and image recognition. I expect that to improve further with new AI and machine learning capabilities.
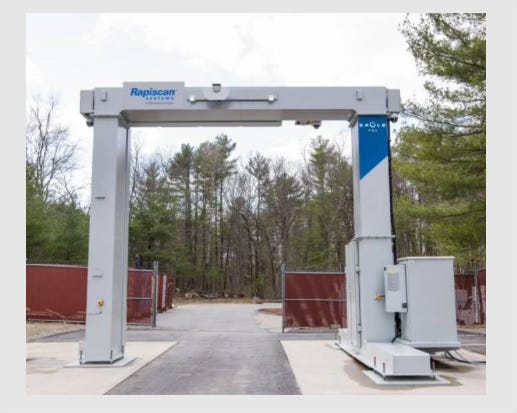
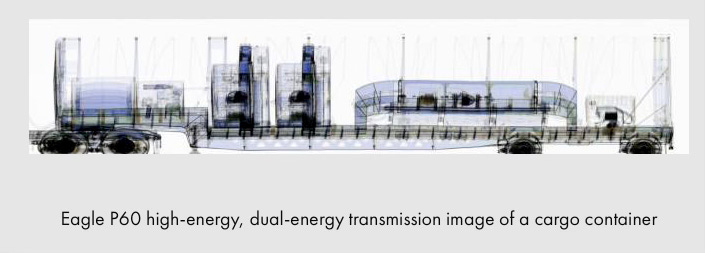
To expand on cargo products more, I’ll dive a little more into the $500M contract with Mexico’s SEDENA ($600M when factoring in taxes). OSI is providing its Eagle P60 cargo inspection systems which is built to fight fraud, drug smuggling, and counter-terrorism. Chopra explained in the April 2023 earnings call after announcing the contract:
“Under this award, we expect to provide multiple units of our Eagle P60 high-energy drive-through cargo and vehicle inspection systems, back care cargo inspection portals, car view vehicle inspection systems and our proprietary CertScan software multisite integration platform. These solutions are planned to be utilized to inspect trucks, buses and cars at customs border checkpoints, increasing the safety and integrity of Mexico's borders. We are honored for our solutions to play a crucial role in facilitating the smooth flow of trade.”
There’s been several other similar smaller contracts for the cargo products with the incentive to the country of improving trade relations. That includes another $200M contract announced in January 2023 to an unnamed international customer and a five-year indefinite contract with an indefinite value in excess of $200M to the U.S. Customs Border and Protection (“CBP”) agency announced in October 2021. Taken together, cargo products have been a critical factor driving growth at OSI.
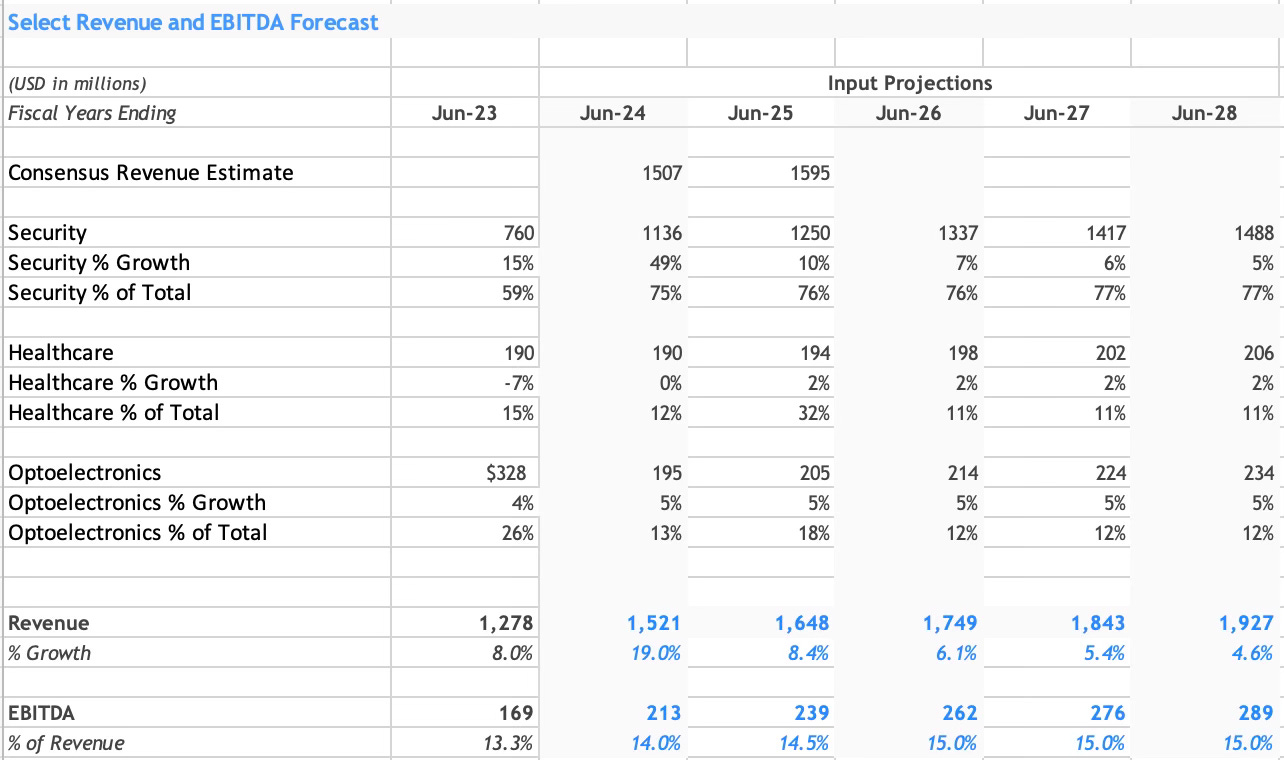
OSI management most recently gave guidance for 2024 in its October 2023 earnings release for fiscal Q1’24 results. At that time, the expectation for fiscal 2024 revenue growth was 'in excess of 18%', which would represent $1,504M. For context, revenue growth was 3% in 2022 then 8% in 2023. The expected 18% extends momentum with an acceleration in growth. OSI typically gives a standard guidance range but management has opted to give a rough number by saying “in excess” due to the uncertainty of the timing of revenue, including its large contracts, which will also depend on component suppliers. Despite the murky guidance, management says its backlog provides “exceptional visibility”.
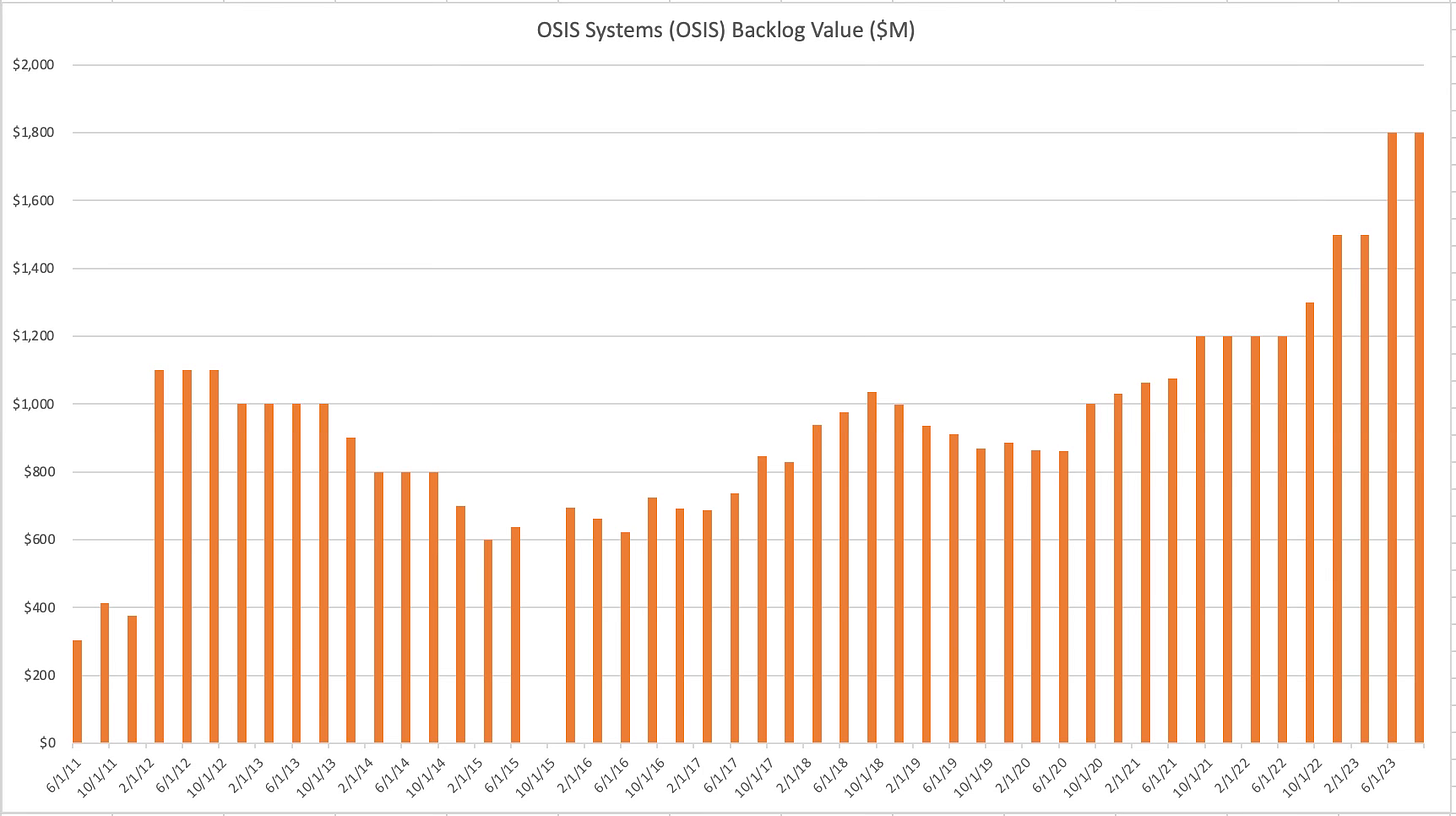
OSI’s backlog was at a record high of at $1.8B as of September 30, matching the rough figure given for June 30. OSI’s book-to-bill ratio (orders received verus equipment delivered) has been strong for the past three years and therefore the backlog has been trending higher since the middle of 2020. It’s an additional data point cementing the strong sales momentum.
Despite the large backlog of orders, the sell side analyst estimates aren’t enthusiastic. The average estimate of sales for fiscal 2024 is $1.51B, equal to a 17.9% increase from 2023. For 2025, The average estimate is $1.6B, or 5.9% YoY growth. The 2025 figure implies a material slowdown in growth. However, OSI has strong momentum and their backlog is enough to satisfy above-trend growth for at least two years.
A quick mention on the other two segments, optoelectronics and healthcare. As noted earlier, external revenue generated by optoelectronics comes from a diverse blend of industries and should continue to grow at a rate in-line with the economy. OSI has done a good job winning additional business through contract manufacturing which can continue to grow at a rate slightly higher than American GDP for the foreseeable future. Management has touted high reinvestment rates for the healthcare business and a shift to a subscription service. I’m not enthusiastic about OSI’s healthcare business but it is a shrinking piece of the pie and is becoming immaterial.
Valuation: I put together a discounted cash flow model by forecasting revenue and margins, for the next five years. The healthcare and optoelectronics segments are expected to grow steadily at ~2% and 5%, respectively, over the next five years. Those figures generally match the growth rates over the past decade. The security business shows a significant ramp-up in sales in 2024 and into 2025, then tapers to 5% growth in fiscal 2028. Recall CAGR growth rate of the security segment is 7.4% over the past decade.
The model also forecasts a gradual, modest increase in EBITDA margins. There’s a few reasons for this starting with the fact that the security segment has better margins than the other two segments and by 2028 OSI could be generating 78% of its revenue from the security segment. Over the last 10 years, the EBITDA for the security segment averaged 18.8% (closer to 15% when you attach some corporate costs to the sector) so a company-wide EBITDA margin of 15.0% seems reasonable. Moreover, the security segment could be shifting toward more turn-key contracts where OSI supports the customer by operating the hardware, in addition to selling the hardware. Two more reasons that support the forecast of higher margins are higher operating leverage as OSI continues to grow and a potential shift to leasing and selling more software services.
Some simple assumptions to calculate free cash flow are as follows: CapEx at about 1.6% of revenue per year, depreciation and amortization at 3.8% of revenue and a pro-forma tax rate of 22%. The other critical assumptions are the cost of capital of 7.6%, which is based on OSI’s beta of 0.97, and current five year risk free rate of 4.0%. Together, this calculates a fair value of about $185, which implies 42% upside in the stock price.
Most of these deep dives use an EBITDA exit multiple, but for OSI I opted for a perpetuity exit using a terminal growth rate of 3%. The terminal value would be equal to 14X EBITDA (LTM). OSI has traded more closely to 11X so that level is slightly high. However, I built a peer list for OSI of stocks mentioned in the competitor section and several others in the industry of similar size. The median 5 year CAGR for revenue for the peer list is 5% and the EV/EBITDA (LTM) is 14.1X. Having said that, I understand why OSI trades at a discount. Their revenue has fluctuated a lot more than their peers and no investor wants to ride a roller coaster.
Final Thoughts: OSI, led by the security segment, has strong momentum right now and it’s making for an undervalued stock. I will stamp shares with an outperform/buy rating. I do note there could be turbulence in the financials in the next year as OSI ramps up sales to meet its larger contracts. This could be supply chain oriented or customers who aren’t ready to accept orders just yet. Regardless, with a long-term view, OSI appears to have a good margin of safety with the calculated $185 fair value via the DCF model.
Another point of interest for investors should be the succession plan for CEO Deepak Chopra. At 72, Chopra will likely need to hand over the reins in the near to medium term. EVP Ajay Mehra, who has effectively overseen the high-performing cargo business, might not be the ideal successor due to concerns about optics. With Chopra leading OSI for 36 years, a transition of leadership for this $2+ billion company should be thoughtfully executed. Rather than an easy handover to Chopra’s cousin, Ajay Mehra, a broader strategic initiative might be more fitting. This could involve divesting the healthcare business to streamline OSI, or potentially pursuing a transformative acquisition or reverse Morris trust spinoff to rejuvenate the management team. Additionally, there's uncertainty regarding how a potential return to the presidency by Donald Trump could impact OSI. While his administration might favor border security, his stance against globalization and trade could lead South American countries to reassess investments in cargo security aimed at boosting trade. I’ll continue to monitor OSI and am eager to see how the company navigates this new growth cycle in 2024.
Disclaimer: The content of this report is for informational and research purposes only and should not be construed as financial advice. The views expressed are my own and do not reflect those of my employer. While care has been taken in preparing this report, I make no representations or warranties of any kind regarding its accuracy or completeness. I currently hold no position in any stock mentioned. However, like any financial analyst, my perspectives may carry inherent biases. Readers are encouraged to conduct their own due diligence.

