SPS Commerce (SPSC)
Strong financial performance driven by a network effect and good go-to-market strategy
SPS Commerce (SPSC) SPSC 0.00%↑ helps transform supply chain management through its cloud-based solutions. The company simplifies the exchange of data across the retail ecosystem, making it easier for a diverse array of participants including retailers, grocers, distributors, suppliers, and logistics firms to manage and share critical information like item details, inventory, orders, and sales data. This simplification is achieved through SPS' innovative full-service model, which applies its team of experts who take on the responsibility of optimizing, updating, and operating this technology for the customers.
By leveraging the services of SPS, companies are empowered to enhance their supply chain performance, fine-tune inventory levels for better sell-through rates, cut operational costs, and improve the visibility of orders. Moreover, SPS' solutions play a crucial role in helping businesses meet the consumer's growing expectation for a seamless omnichannel shopping experience, which has become a cornerstone of modern retail.
As the retail sector continues to evolve, driven by shifts towards ecommerce and heightened consumer expectations for flexibility and speed, the demand for integrated, omnichannel supply chain solutions is heightened. SPS' cloud-based retail network acts as a nucleus in the retail landscape, offering a unified platform where businesses can manage transactions across all channels efficiently. This not only streamlines operations but also significantly reduces the likelihood of errors, fostering a more cohesive and responsive supply chain ecosystem.
The themes of a shifting retail sector and a meaningful network effect are positive attributes of the investment rationale in SPS. SPS has a history of good execution and consistent strong financial results, driven by its community success. The risk/reward is well-balanced, with a strong network helping fend off threats and drive future growth. The valuation calculations imply modest upside of 26% upside to the current stock price.
The rest of this analysis will cover SPS by providing an overview of the business and the competitive edge followed by an examination of the capital allocation history, management and their incentives, capped with an outlook and valuation.
Business Overview: SPS offers a suite of products designed to modernize the way businesses across the retail spectrum—from grocers to logistics firms—manage their operations and trading relationships. The company's solutions aim to replace outdated manual processes and fragmented systems (such as email, phone and fax) with a unified approach through its extensive retail network. This is the concept of an electronic data interchange (“EDI”).
At its core, EDI is the computer-to-computer exchange of business documents in standardized electronic formats between trading partners. This technology enables businesses to automate the transaction process, resulting in significant benefits like reduced operational costs, faster processing times, minimized errors, and strengthened partner relationships. Unlike processes that rely on human intervention, such as email, EDI allows direct interaction between the partners' IT systems, enabling documents like purchase orders, invoices, and shipping notices to be processed instantly and without manual input. This automation ensures that data flows seamlessly from one system to another, facilitating a more efficient, accurate, and cost-effective supply chain operation. It’s like having a universal translator between business, and this is especially useful when one retailer has multiple suppliers and vice versa.
SPS doesn’t report separate business segments, but they do categorize their product lineup into three main areas:
Fulfillment (80.8% of revenue): This cornerstone product provides a scalable EDI solution that allows companies to manage orders across channels. Tailored for flexibility, Fulfillment can be configured to match any trading partner's requirements, facilitating seamless supply chain management with a comprehensive set of tools.
Analytics (10.4% of revenue): Aimed at enhancing product sales visibility, the Analytics product offers organizations a unified view across all sales channels. It leverages SPS Commerce's extensive network and expertise to grant better access to and utilization of sales and inventory data, helping businesses to make informed decisions and optimize performance.
Other Products (1.8% of revenue): Under this category, SPS provides additional solutions like Assortment, which simplifies the management and communication of item data across various sales channels, and Community, designed to digitize supply chain processes and bolster supplier collaboration through effective onboarding programs.
These offerings, complemented by one-time services like professional services and testing and certification, underscore SPS’ commitment to facilitating more efficient and integrated supply chain and omnichannel retail operations worldwide.
SPS Commerce harnesses the power of its extensive cloud-based retail network to foster connections between various players in the supply chain, including retailers, grocers, distributors, suppliers, and logistics firms. This network acts as a catalyst for new customer acquisitions, leveraging the "network effect" as a foundational pillar of its growth strategy. The concept is simple yet profound: the value of SPS' network multiplies with each additional connection, making it easier for existing and new customers to find and collaborate with trading partners already on the platform. This interconnectivity not only facilitates seamless information exchange but also encourages incremental sales opportunities and revenue streams for all network participants.
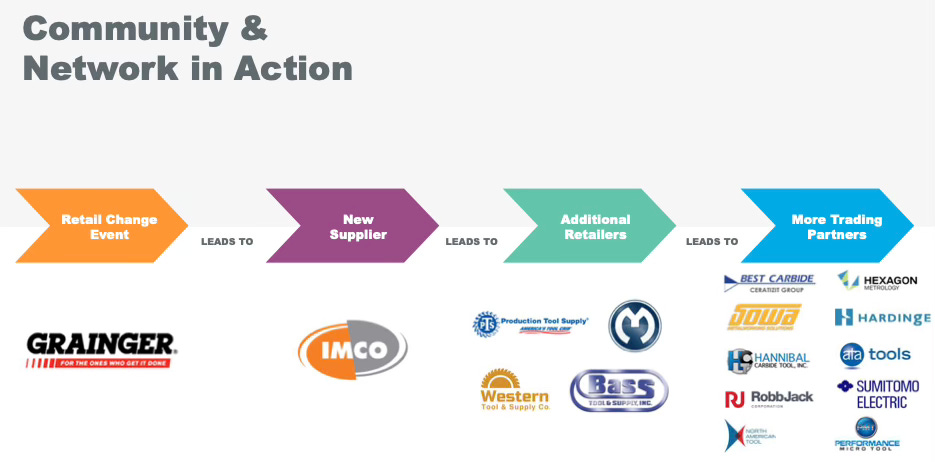
The expansion of SPS' network is driven by various customer acquisition sources. The company's Community product plays a crucial role in adapting trading relationships to the evolving demands of an omnichannel retail environment, generating supplier leads in the process. Additionally, referrals from within the existing customer base introduce new participants to the network, further enriching its diversity and utility. SPS also engages in direct marketing efforts, ranging from digital campaigns to industry events, aimed at capturing the attention of key decision-makers. Moreover, collaborations with channel partners, including major ERP software providers and logistics companies, extend the reach of SPS' products, embedding them into broader service offerings and driving new sales. Through these multifaceted strategies, SPS Commerce continually strengthens and expands its network, underscoring the company's commitment to enhancing the efficiency and connectivity of the retail supply chain.
To illustrate SPS Commerce's go-to-market strategy more concretely, let's explore a practical example. Imagine SPS gets a lead from an ERP vendor that Dick's Sporting Goods (DKS) is transitioning to a new ERP system (change event). This period is an opportune moment for SPS to introduce their EDI solutions, facilitating a seamless switch for the retailer from their existing EDI provider. SPS' strategy involves a collaborative effort to onboard all of Dick's suppliers, including companies like Ping and Callaway, each likely using distinct formats for invoices, purchase orders and other documents. By standardizing these communications through their EDI system, SPS streamlines the data exchange, enhancing supply chain visibility for Dick's and enabling suppliers to better manage their inventory, thanks to precise insights into product movements.
The strategy of SPS' monetization model primarily targets the suppliers by charging them based on their number of connections within the network, rather than the retailers. This approach not only ensures a more extensive digital network but also encourages suppliers like Ping to advocate for SPS' EDI system with their other retail partners, thereby amplifying the network effect. As these relationships grow, so does the ecosystem of interconnected partners, creating a cascading effect of increased efficiency, enhanced data accuracy, and more informed decision-making across the entire supply chain. Note that I don’t know if Dicks is a customer of SPS, but I do know Ping is a customer, according to a case study on SPS’ website. I like this example because I bought a Ping putter last month and you’d be shocked just how many options there are for a putter, not just head but shaft style too. And I can imagine how much Ping can benefit as a supplier knowing what inventory is at their retailers.
SPS Commerce is strategically positioning itself to capture a significant portion of the global retail network and supply chain management market, with an eye on a total addressable market (TAM) of $5.0 billion, a figure SPS has stated for four years now. Given that TAM has likely grown, SPS has low penetration when compared to 2023 revenue of $536.9 million. The company's growth strategy is multifaceted, aimed at cementing its status as the leading provider in this space. A critical aspect of this strategy involves deeper penetration into the current market, which SPS views as underexploited. With the retail industry continuously adapting to the omnichannel marketplace's demands and the supply chain ecosystem growing in complexity, SPS anticipates an uptick in demand for its solutions. The company plans to leverage existing customer relationships and their networks to generate new sales leads, aiming to increase revenue from its current customer base by encouraging the adoption of additional products and services.
Innovation and acquisition are also components of SPS' growth agenda. The company is committed to refining and expanding the capabilities of its cloud-based products, occasionally introducing new offerings to meet evolving market needs. Strategic acquisitions are part of its growth strategy with an emphasis on selective integration that broadens customer reach, enhances product functionality, or extends geographic presence.
SPS identifies a substantial market opportunity in assisting organizations to expedite their omnichannel retail strategies. The need for new connections and transactions is growing as businesses expand across wholesale, eCommerce, and marketplaces, making SPS' retail network an integral part of their omnichannel approach. Furthermore, the retail sector's push for automation—driven by fluctuating store openings and closings, labor shortages, and shifting buying patterns—underscores the necessity for agile and efficient supply chain solutions. SPS' offerings enable businesses to swiftly adapt to market changes and maintain a competitive edge through enhanced visibility and automation.
Moreover, the consumer demand for new and differentiated products adds another layer to the market opportunity. Retailers are constantly refreshing their assortments to keep pace with trends and consumer preferences, necessitating robust trading partner relationships that can support quick product introductions. SPS' network facilitates these dynamics, ensuring smooth operations and enabling retailers to achieve their merchandising objectives.
Building on the foundation of meeting consumer demands and supporting dynamic retail assortments, SPS Commerce further solidifies its market position through its advanced technology, development, and operations framework. Embracing cloud services since 1997, SPS has positioned itself as a pioneer in cloud-based solutions for the retail supply chain management industry. At the heart of its technological infrastructure is a multi-tenant cloud-service model. This approach allows SPS to treat all customers as separate entities within a shared environment, enhancing scalability and cost-efficiency by distributing operational expenses across its broad customer base. Unlike single-tenant solutions, where each customer requires a separate instance of the software, SPS' multi-tenant architecture enables rapid scaling and streamlines updates, without the need to manage numerous distinct applications.
The company's commitment to innovation is evident in its research and development efforts, primarily conducted across strategic global locations. By focusing on multi-tenant products, SPS maintains lower research and development costs and introduces software updates more frequently than is typical with traditional on-premise software. Operations are managed through third-party data centers and cloud providers, ensuring high availability, redundancy, and continuous performance monitoring. This operational excellence, coupled with a dedicated global sales force and a comprehensive marketing strategy, underpins SPS Commerce's ability to deliver customer success and retention. Through this integrated approach, SPS not only enhances its service offerings but also ensures that it remains at the forefront of facilitating efficient, robust trading partner relationships in the ever-evolving retail landscape.
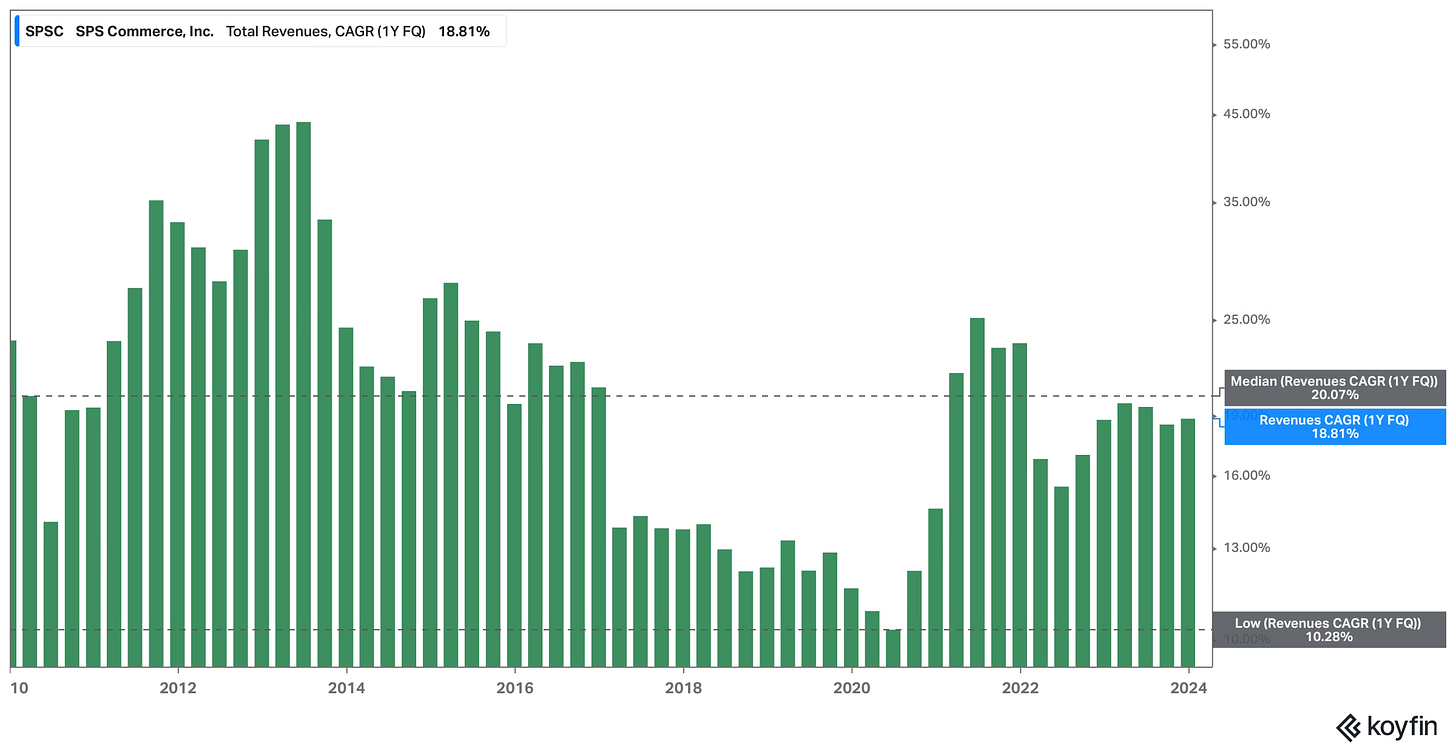
Financial Performance: SPS began trading in 2010 and it generated $44.6M in revenue that year. That figure has increased to $536.9M in 2023 for a compounded annual growth rate (“CAGR”) of 21.1% per year. While that growth rate is impressive, SPS’ relatively steady annual growth has also been impressive. SPS has had positive quarterly growth year-over-year (“YoY”) for 92 straight quarters (23 straight years dating back to 2000). Koyfin has quarterly data going back to Q4’09 and since then the lowest YoY growth rate was 10.3% and the median is 20.1%.
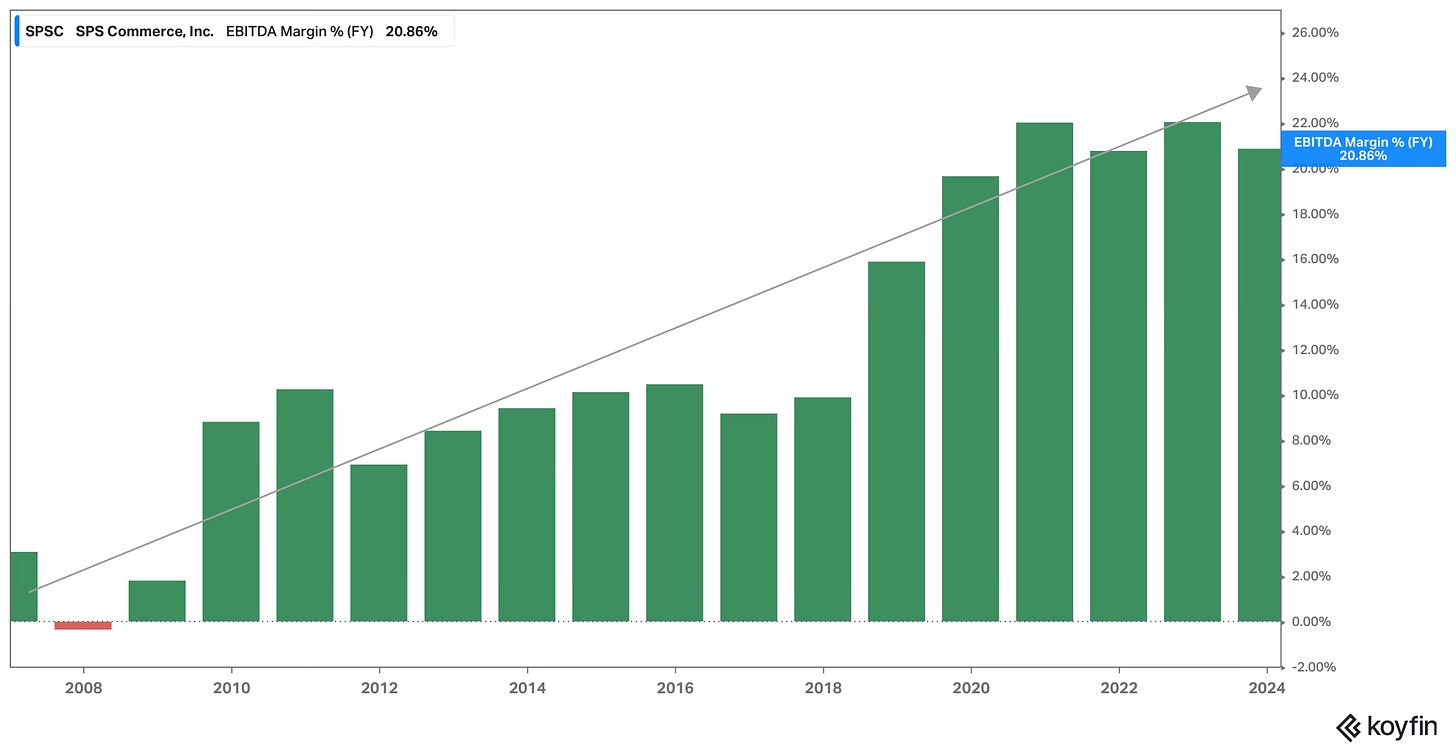
SPS has also exhibited a trend of increasing profitability over the past 20 years. In 2006, EBITDA margins were about 3%. During the past four years (2020 to 2023), EBITDA margins have been tightly focused near 21.0%.
When you common size the different costs on the income statement against revenue, you can quickly see the improvement in margins has been garnered through a steady drop in sales & marketing expenses. In 2013 sales & marketing expenses made up 38.0% of revenue and by 2023 that number dropped to 22.9%. Research & Development as a percent of revenue, and general & administrated costs as a percent of revenue stayed steady over the last decade. Gross margins dipped slightly due to the rise of cost of revenue (“COGS”) which made up 30.4% of sales in 2013 and now makes up 33.9% of revenue. The steady drop in sales & marketing spend, relative to sales, shows efficiency considering growth hasn’t slowed significantly over the past decade.
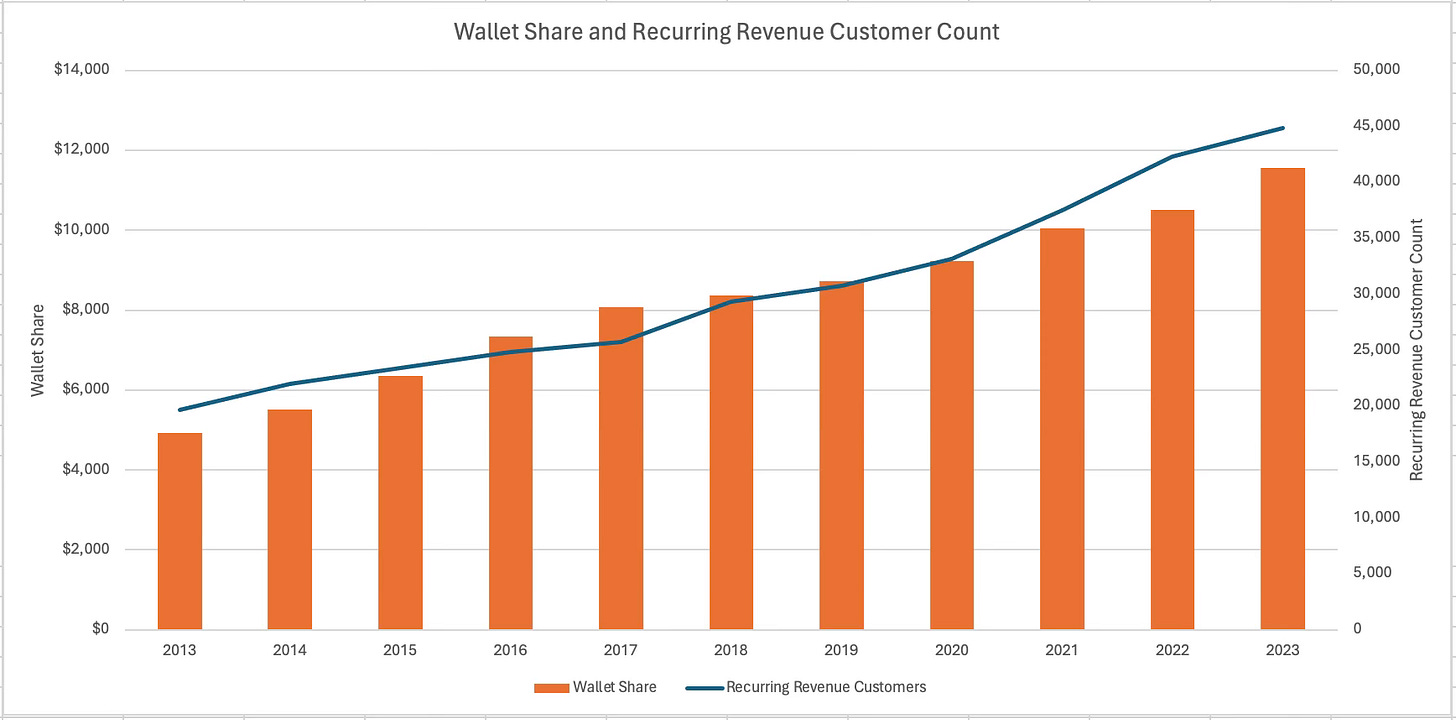
Two other relevant KPIs for SPS is the number of recurring revenue customers and recurring revenue per customer, which SPS calls wallet share. Here’s the quote of their definition.
Wallet Share - We calculate average recurring revenues per recurring revenue customer, which we also refer to as wallet share, by dividing the recurring revenues from recurring revenue customers for the period by the average of the beginning and ending number of recurring revenue customers for the period.
I extracted data for wallet share and recurring revenue customers back through 2013. Wallet share in 2013 was $4,920 which increased at a CAGR of 8.9% to $11,550 in 2023. The number of recurring revenue customers similarly increased at an annual rate of 8.6% from 19,690 customers in 2013 to 44,800 in 2023. It’s nice to see both the number of customers and average revenue per customers increasing at similar rates over the past decade, implying SPS isn’t simply increasing the price or adding customers. It’s able to do both.
Competition: In the landscape of supply chain management (SCM), companies navigate through a complex matrix of offerings, from traditional on-premise solutions to innovative cloud-based services. Among these, SPS Commerce emerges as a distinctive player with its full-service model, contrasting sharply with its three named competitors from the 10-K: IBM IBM 0.00%↑ , OpenText OTEX 0.00%↑ , and privately-held TrueCommerce. Understanding these entities and their competitive dynamics sheds light on how SPS Commerce has carved its niche in the industry.
IBM, a behemoth in the technology sector, offers a range of Supply Chain Management (“SCM”) solutions, including its Sterling suite. Focused on traditional on-premise software as well as managed services, IBM Sterling caters to businesses seeking robust, customizable solutions that they can control and manage internally. This "do-it-yourself" approach requires significant investment in both hardware and skilled personnel to maintain the systems, offering a single-tenant architecture that ensures dedicated resources and customization for each client. However, this model often involves higher upfront costs and complexity, potentially limiting its appeal to larger organizations with the necessary resources.
OpenText specializes in information management software, including supply chain management solutions. Similar to IBM, it offers both on-premise and cloud-based managed services, focusing on businesses that prefer to manage their supply chain integration with a blend of internal and external resources. OpenText's acquisition strategy has expanded its portfolio but also indicates a reliance on acquisitions for growth. This approach, while expanding its capabilities, may dilute its focus on organic innovation within the supply chain segment.
TrueCommerce positions itself as a provider of managed service solutions in the supply chain space, offering cloud-based products that combine technology development and maintenance with customer-led daily operations. This model aims to strike a balance between fully managed and self-managed solutions, offering a degree of customization and operational control without the full burden of on-premise software management. TrueCommerce, through this hybrid approach, competes by offering scalability and flexibility, appealing to a wide range of businesses seeking to streamline their supply chain operations.
SPS Commerce is notably different than its peers by primarily focusing on its full-service cloud-based model. Unlike its competitors, SPS Commerce delivers a comprehensive solution that encompasses not just the technology but also the resources to customize, optimize, and operate it. This approach significantly offloads the burden of managing SCM products from businesses, allowing them to focus on their core competencies rather than the intricacies of supply chain management.
When I looked up online reviews for the different EDI providers, I often didn’t see SPS at the top. For instance, software review aggregator G2 lists TrueCommerce as number one followed by SPS and then IBM’s Sterling. From what I gathered users tend to favor SPS’ ease of use and UI, but dislike the tack-on fees and aggressive sales tactics. A good research tactic is reading what other competitors also say about the subject company. So in this case I found the OpenText blog post titled “Time to take a closer look at SPS Commerce reviews” enlightening. OpenText acknowledges SPS is often the “early bird” in talking to potential customers first and rushing them along to close a sale. Recall the go-to-market strategy begins with a software change event, then as soon as a retailer joins SPS, they make it a mission to on-board all of the suppliers of said retailer. It’s a successful playbook for SPS that’s underscored by its impressive financial performance and stock growth.
The competition section of the 10-K highlights key factors that differentiate cloud-service vendors: the breadth of network connections, reliability, reputation, price, market specialization, integration speed and quality, product functionality, complementary product offerings, and customer support. SPS Commerce's positioning as a full-service provider leverages these factors to its advantage, offering a compelling value proposition that has enabled it to outperform peers like OpenText and IBM in both financial growth and stock performance.
SPS Commerce's model of providing a fully managed, cloud-based service has resonated with businesses looking for scalable, efficient, and cost-effective supply chain solutions. The message has been delivered to clients as well. Former CEO Archie Black discussed this by saying SPS has a successful go-to-market strategy whereas its competitors don’t. This has not only allowed SPS Commerce to grow organically at an impressive rate but also to distinguish itself from competitors who either focus on traditional on-premise solutions or a mix of managed services that require more involvement from the customer's internal team.
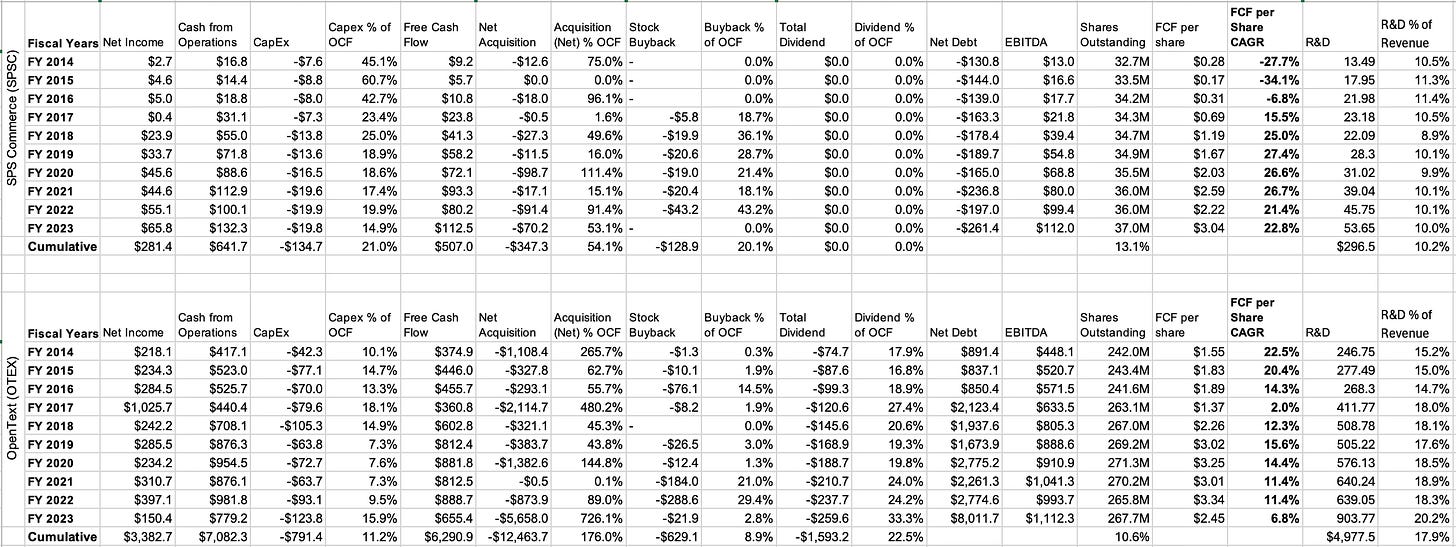
Capital Allocation: In order to analyze capital allocation, I’m going to compare SPS against Open Text. Over the last 10-years (2014 to 2023), SPS generated $641.7M in cash from operations. They spent $134.7M back into the company via capital expenditures, equal to 21.0% of the cash from operations. $347.3M was spent on acquisitions (54.1% of cash from operations) and another $128.9M was spent on buybacks (20.1% of cash from operations). There’s been no dividend payouts. Given that the four buckets of capital allocation (CapEx, M&A, buybacks and dividends) is less than the cash generated, it means SPS has been building its cash position. SPS has an immaterial amount debt and has been operating the business with a net cash position.
The strategy for buybacks has been to opportunistically return cash to shareholders during periods of weakness. SPS has frequently been in the market for its shares since 2018 and it’s notable that they’ve accelerated into weakness multiple times, a good indication that management applies a valuation-based approach to capital allocation. The strategy around M&A has been fairly tactical with modest acquisitions. The largest acquisition was Data Masons, a provider of EDI System Automation solutions for the Microsoft Dynamics market, in December 2020 for $100.0M. Data Masons was a competitor to SPS and added modestly to the customer count. Management at the time said the acquisition expands SPS' position in fulfillment system automation for Microsoft ERP customers. CEO Archie Black said:
“The primary rationale of this deal is that combined, we think we can sell more, and we think we can have a better customer service [experience]. So that's really the rationale of the deal. So in the non-Microsoft space, it's business as usual in the Microsoft part of our business, it will be an acceleration. So we really don't -- this is not a cost synergy play. This is really a growth plus customer experience story.”
In 2022, SPS spent $45.1M to buy GCommerce, an EDI provider in the automotive industry. The acquisition of InterTrade that same year for $49.1M pushed M&A spend near $100M in 2022 again. InterTrade’s EDI solution was focused in the apparel and general merchandising markets. The last material transaction worth noting was TIE Kinetix in September 2023 for $68.7M. TIE Kinetix was a provider of supply chain digitalization e-invoicing in Europe and the United States. The business was 60/40 Europe/US. Where they excelled was e-invoicing for tax purposes that’s mandatory in Europe. Overall all these were bolt-on in nature.
As for OpenText, the company spent $791.M on capital expenditures (11.2% of cash from operations), $1.6B on dividends (22.5% of cash from operations), $629.1M on buybacks (8.9% of cash from operations). The standout metric is the $12.5B spent on acquisitions (176% of cash from operations). By spending near 2X the cash it’s generated from operating the business, OpenText has been tapping the debt market and currently has ~5X net debt/EBITDA.
Almost half of the total M&A spend during the last 10-years at OpenText was on enterprise software company Micro Focus in 2023 for $6.2B, when including debt. That deal was priced at a significant, 99% premium to the market price of Micro Focus at the time. Via Forbes, Moody’s said at the time:
“Both companies generate a large share of their revenues from declining and mature products and the challenges are compounded by the highly competitive software segments they operate in that are increasingly adopting cloud software solutions.”
There’s two other acquisitions greater than $1.0B in the past decade for OpenText. In December 2019 they spent $1.4B on Carbonite, a provider of backup, disaster recovery and endpoint security to small and medium-sized consumers. OpenText also did a big acquisition in January 2017 when it spent $1.6B for the enterprise content division of EMC Corporation. OpenText CFO Madhu Ranganathan told Forbes in an interview:
“We have done over 80 acquisitions. We have doubled the size of the company between 2019 and 2022. We look at timing, the quality of the assets, the opportunity for value creation, and return on investment. We try to integrate the acquired company before the deal closes.”
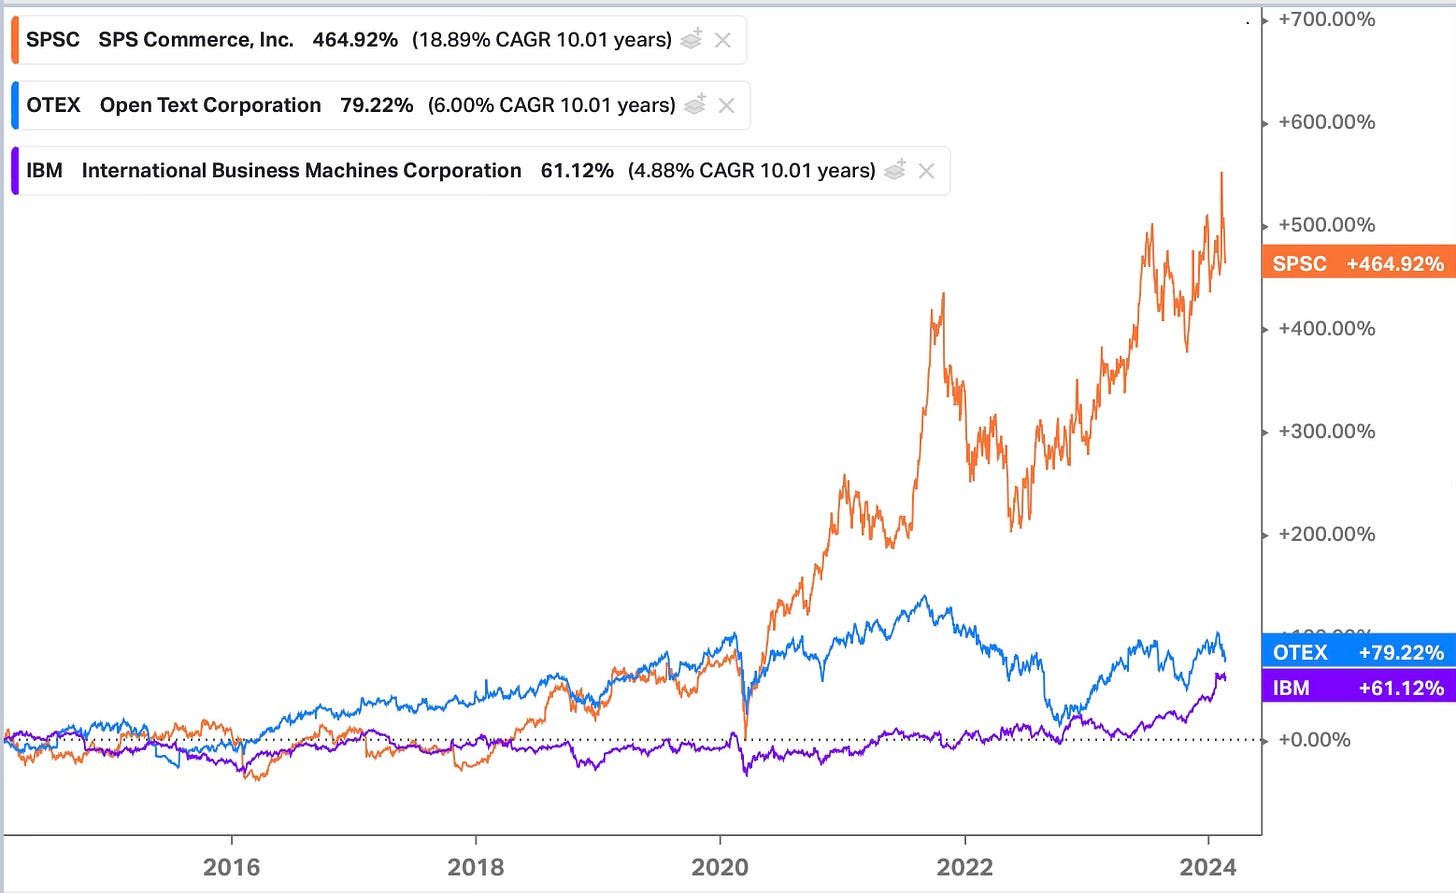
The series of major acquisitions, and only modest buybacks, has come with OpenText shares outstanding increasing by 10.6% since 2014. By comparison, SPS’ shares outstanding increased by 13.1% over the same period. However, free cash flow has increased more rapidly. In 2014 SPS had free cash flow per share of 17 cents that increased to $3.04 by 2023, representing a 22.8% CAGR. OpenText had FCF per share CAGR of just 6.8% in the last 10 years. This largely explains the difference in stock performance with SPS shares doing 18.9% CAGR and OpenText doing just 6.0%.
Before wrapping up the capital allocation portion, I wanted to compare organic reinvestment a bit more. Particularly because SPS invested notably more on CapEx, on a relative basis, and less R&D than OpenText. SPS Commerce reinvested 21% of its cash from operations towards CapEx, about half of which was invested in internally developed software according to the balance sheet footnotes. This strategy not only emphasizes their commitment to enhancing and expanding their technological capabilities but also indicates a preference for capitalizing costs associated with software development. This showcases a judicious investment strategy by sensibility investing internally, aligning with accounting practices that favor capitalization when the resulting assets are expected to generate predictable, long-term value. This methodical approach to reinvestment has been mirrored in SPS' strong financial performance, underscoring a prudent yet effective deployment of capital that supports sustainable growth and bolsters investor confidence.
On the other hand, OpenText's allocation strategy—marked by a lower percentage of cash flow directed to CapEx and an aggressive 18% of revenue funneled into R&D—paints a picture of a company heavily invested in fostering innovation and expanding its technological frontiers. This aggressive R&D investment, while indicative of a forward-looking stance, also reflects a high-risk, high-reward philosophy that has not translated into proportional financial performance or stock appreciation as effectively as SPS. The stark contrast in their financial trajectories suggests that OpenText's expansive R&D expenditure, though potentially positioning the company at the forefront of technological innovation, may not be yielding immediate financial returns in the same way SPS' more conservative and focused reinvestment strategy has.
Management and Incentives: SPS was founded in 1987 and was called St. Paul Software, of course, based in St. Paul, Minnesota. Archie Black joined the company in 1998 as CFO during the tech boom. St. Paul Software operated like other technology companies in that era by regularly burning cash. By 2000, St. Paul Software focused the business by leaning into the EDI and selling their software business to Tie Commerce. Black was elevated to CEO in 2001 and St. Paul Software renamed itself to SPS Commerce that year. Black continued to lead SPS, alongside COO Jim Frome, until retiring in October 2023. In July 2023, SPS disclosed that Frome will retire at the end of 2024, and on February 29, 2024 SPS added that Black will step down as chairman and depart the board on December 31, 2024.
Black has been succeeded by Chad Collins, who was most recently served as CEO of Software for Korber Supply Chain within Germany’s Korber Group. After starting his career at Ernst & Young, Collins joined Minnesota-based HighJump Software in 2002. HighJump was acquired by Accellos in July 2014, backed by its PE owner Accel-KKR. Accellos was then reorganized as HighJump Software, which provided supply chain execution software, and TrueCommerce, which is SPS’ closest overall peer. Collins became CEO of the HighJump business and Accel-KKR then separated it from TrueCommerce in 2017 when it sold HighJump to Korber for ~$750M, and Collins went with it. As an aside, Accel-KKR more recently sold TrueCommerce to PE firm Welsh, Carson, Anderson & Stowe (“WCAS”) in December 2020. Collins is a fitting hire for SPS because of his deep supply chain software experience and he’s local to Minneapolis. Not only will be sufficiently knowledgeable as a leader I expect he’ll fit in culture-wise. SPS has generated about 85% of sales from the U.S. in the past five years. Ideally Collins can apply his global experience from Korber to help drive SPS sales outside of the U.S.
Despite the succession at the top ranks of SPS, the CFO role has held steady with Kim Nelson holding that title since 2007. Nelson joined SPS from Amazon where she led investor relations from 2005 to 2007. From what I can tell Nelson is a solid CFO and after 16 years with SPS, it’s nice seeing her stay during the CEO succession.
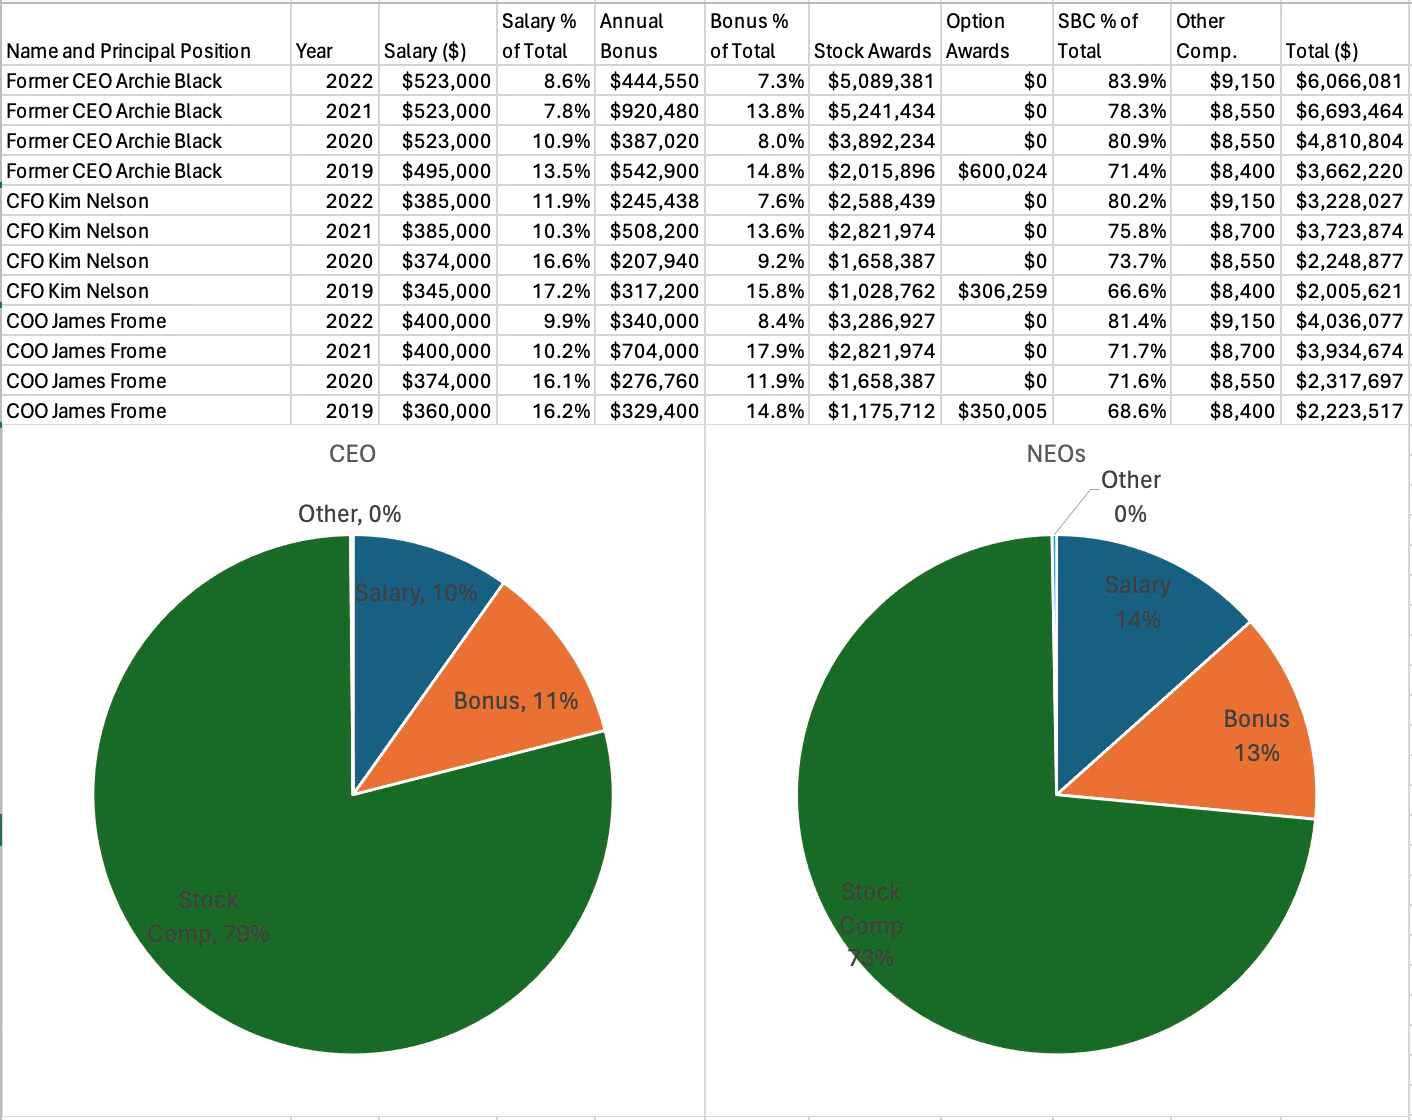
SPS Commerce’s executive compensation program is split between salary, an annual cash bonus, stock awards paid in the form of restricted stock units (“RSUs”) and performance stock units (“PSUs”). The following analysis uses the March 2023 proxy and I’m going to generalize by incorporating incentives for Black and Frome. Note that SPS filed an employment agreement for Collins when they hired him and disclosed that his pay and incentives match the existing executive compensation elements. The only difference was that Collins will actually be paid more than Black, which is mildly unusual as new executives generally have to work their way up to a tenured executive’s pay like Black.
During the six year period from 2017 to 2022, former CEO Black was paid about 10% of his total compensation in salary while Nelson and Frome were slightly above that at 13%. The annual cash bonus made up 11% and 13% for Black and Nelson/Frome, respectively, while stock-based compensation made up 79% for Black and 73% for Nelson/Frome. Other compensation, which was just 401K contributions, was negligible. The value of the total compensation is slightly low for SPS when comparing to some proxy peers such as of similar size such as Varonis Systems (VRNS) and Paylocity (PCTY).
The two incentives for the annual cash bonus is revenue and adjusted EBITDA. The target value of the cash bonus was 100% of Black’s and Frome’s salary, and equal to 75% of Nelson’s salary. Payouts could range from 0% to 195% (up slightly from the 190% cap in 2021). For 2022, SPS set a revenue target of $454.6M, which compares to their initial full year 2022 guidance of $444M given in February 2022. The adjusted EBITDA target for compensation was $128.4M and that compares to guidance of $125.8M. It’s nice to see the compensation committee set higher financial targets for 100% payout than the guidance delivered.
The last and largest component of executive compensation is paid in the form of stock awards. In 2019, 46% of the grant date fair value (“GDFD”) of equity awards was paid in the form of RSUs, 31% in PSUs and 23% in options. SPS moved away from options beginning in 2020 and inched toward a 50/50 split with half the stock pay in the form of RSUs and half from PSUs. While the weighting has changed during that period, what’s been consistent is that the incentive for PSUs is relative total shareholder return (“TSR”). In order for management to earn 100% of the PSUs awarded to them, SPSC shares have to beat their stated index, the Russell 2000, by at least 5% over a three-year period. Relative outperformance of at least 30% means the PSUs get paid out at a maximum of 200%.
This is a simple and effective way to set up executive compensation and I applaud SPS. In total, roughly 35% of executive compensation is tied to total shareholder return, keeping management focused on the main metric shareholders look after. This focus on relative total shareholder return is similar to Apple (AAPL).
Outlook: SPS just wrapped up 2023 by growing 19% YoY. The February 8 earnings call also included full year 2024 revenue guidance of $617.8M, which represents growth of 15% over 2023. SPS management is expecting some operating leverage because guidance for adjusted EBITDA to increase 16.5% YoY, slightly higher than the revenue growth. Adjusted EBITDA is expected to be $184M in 2024 for a margin of 29.8%.
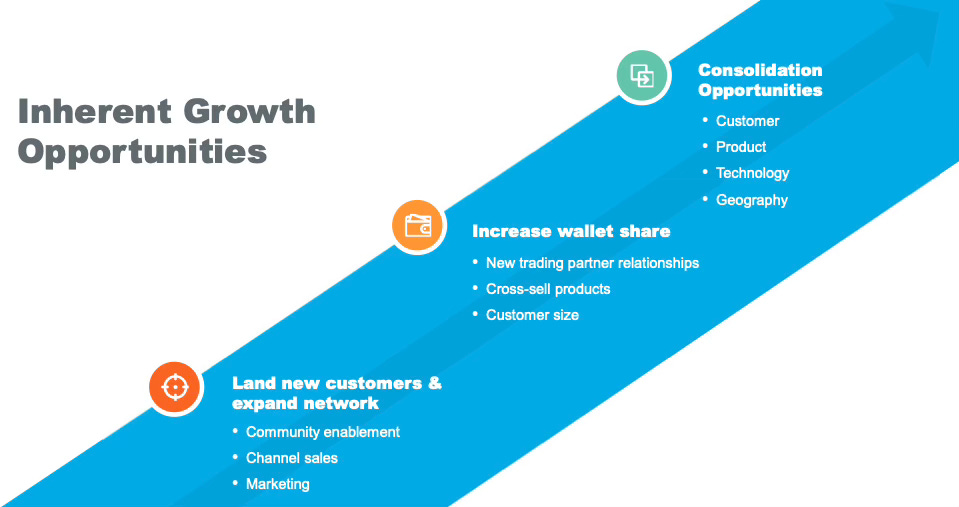
SPS is among the companies that gives a medium-term guidance. Beginning July 2021, management began stating their medium-term goal for growth in recurring revenue is 15% annually, up from their prior goal of 10% annual growth. At that time it was driven by an acceleration in e-commerce and a digital transformation to an omnichannel experience. CFO Nelson reiterated that goal in the February 2024 earnings call. Then more recently, in the March 7 Morgan Stanley TMT conference, Nelson expanded by discussing the four reasons SPS has confidence they can grow at 15% or greater. 1) community success of increasing customer counts by onboarding suppliers of retailers, 2) customer growth leading to higher wallet share, 3) cross-sell opportunities with different products and 4) tuck-in M&A. For greater context here’s the direct quote by Nelson.
“the reason we have such strong conviction and that is because there's multiple levers or multiple ways in which we have demonstrated our growth. And those same ways we believe are still there going forward. When we think about what drives that top line growth, that community go to market that Chad and I have both spoken about, we still see a lot of opportunity there, and that drives us to get more and more on net new customers.
And then over time, those customers grow with us. So there's multiple ways in which that translates into additional revenue for us and size of customers, our channel sales, bringing us to those larger customers. That is an important portion of our business and that will remain going forward. We really see that as a great lead generation as well. Over time, we see the opportunity to not just upsell but also cross-sell with different products. Our two primary products we have today, our fulfillment product and our analytics product. But over time, we see the opportunity to even have more products that can benefit our customers.
So all of those would be reasons that would give us conviction on that top line. And then M&A, we've talked about M&A now. They typically have been more tuck-in type acquisitions really because it's quite and are fragmented in this space. But that certainly we see the opportunity for us. That's a great way to end customers. So roll-up strategy as well as product enhancement, technology enhancement or geographic expansion. And we've done all of those types of acquisitions.”
I view this medium-term goal post as quite attainable for SPS. The company has shown its go-to-market strategy and network effect in particular has been successful in the past. Moreover, SPS’ total addressable market leaves a long runway for growth. Recall the total addressable market is $5.0B, but SPS has stated that TAM for several years now. In a November 2021 Credit Suisse TMT conference Nelson said:
“we've been public for, gosh, 10-plus years, and our TAM and our view of that roughly $5 billion TAM is a number we've had for many years. To your point, we actually think that, that number is greater than the $5 billion. And the reason for that is the way we really sized or scoped that $5 billion opportunity, it was really primarily around 2 products: our fulfillment product, which is our core product, about 80% of our revenue; and our analytics product, which provides point-of-sale and sell-through information and data to the suppliers.
And looking at the large opportunity we saw globally, that would translate to approximately 200,000 customers with an average ASP of 25,000. However, we recognize that there are opportunities, even though that's still a very large opportunity in front of us, we do have the ability to offer some, think of it as add-on products. So you buy our fulfillment products and you can buy some add-on products, will ultimately make the supplier even more efficient. All of the concepts of these add-on products would all then be additive to that TAM.
So our belief as we think the $5 billion TAM is much great. It's definitely greater than that. We just haven't updated that number yet, but the point being, it's a significantly large opportunity in front of us to get more and more customers as well as get it more and more revenue from those customers and how we'll get that revenue from the customers, in some cases, it's just as a supplier is doing business with more and more retailers and in some cases, it's going to be from additional products as well.”
It’s interesting that the commentary regarding TAM was almost 2.5 years now, and therefore the real TAM is likely multiple billions more than $5.0B at this point.
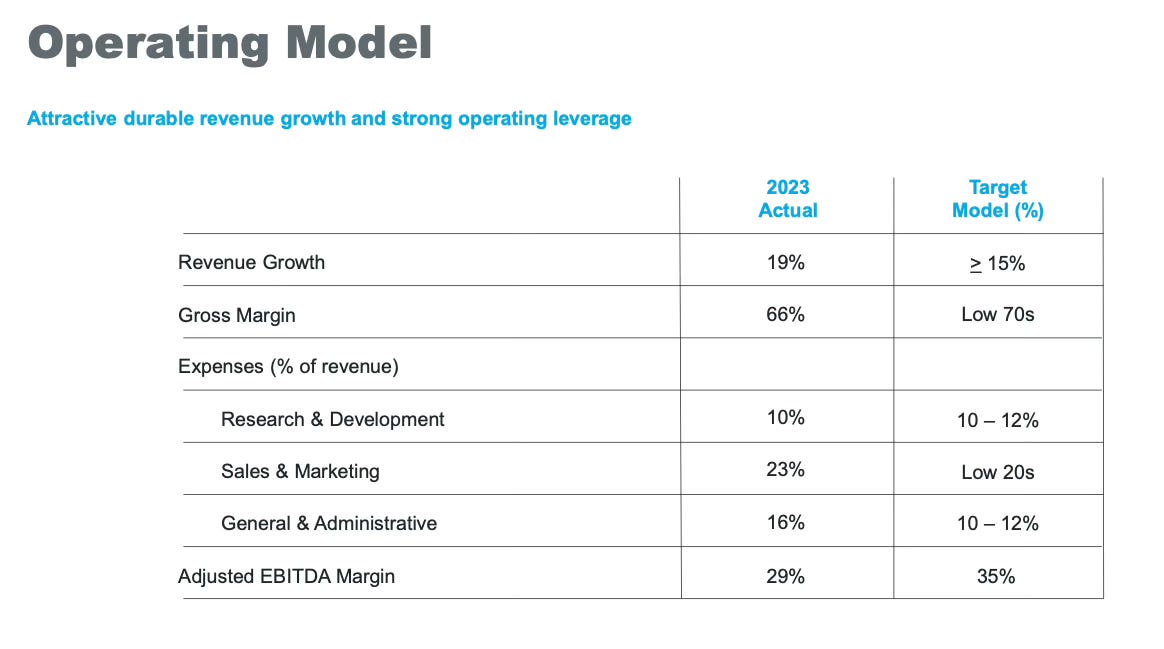
In addition to setting a medium-term growth target, SPS management has articulated an objective of reaching a 35% adjusted EBITDA margin. At the close of 2023, SPS reported an adjusted EBITDA margin of 29.4%, with anticipations of a modest increase to 29.8% in 2024. To meet their ambitious goal, SPS will need to enhance profitability by approximately 500 basis points. CFO Nelson has consistently emphasized that achieving this will largely depend on improving the cost of sales, thereby increasing the gross profit margin. There's also potential to further reduce general and administrative expenses relative to revenue, benefiting from their largely fixed nature coupled with SPS’ positive growth trajectory. However, opportunities to decrease the sales and marketing expenses ratio, currently around 23%, appear limited.
SPS has historically struggled to improve its gross margin significantly over the past decade. However, comparing with peers like OpenText, which maintains a notably higher gross margin, suggests that there is room for improvement as SPS continues to scale. Both OpenText and Manhattan Associates, which are larger entities, manage to sustain lower selling, general, and administrative costs, indicating that SPS could enhance its margins with growth.
Cost of revenue at SPS is made up of personnel costs for customer success, implementation teams, customer support and application support teams, in addition to the technology supporting them. I imagine this line item can get more efficient through artificial intelligence.
While AI presents exciting opportunities for efficiency gains, particularly in customer support sectors, it also introduces potential challenges to traditional EDI frameworks, such as those utilized by SPS Commerce. The advent of sophisticated AI capable of automating the complex extraction and interpretation of business documents could theoretically diminish the necessity for conventional EDI systems, which traditionally depend on predefined templates and intricate setup processes. However, this transformation is not straightforward. The complexity inherent in EDI—ensuring accuracy, standardization, and compliance across diverse formats and standards—poses significant challenges that may not be easily surmounted by automated AI solutions.
Reflecting on the scenario with Dick's Sporting Goods, if retailers and their suppliers were to leverage AI independently for EDI tasks, it would necessitate a substantial reallocation of resources, fundamentally altering their approach to EDI. Despite these possibilities, SPS Commerce's extensive network and deep-rooted expertise in EDI provide a robust defense. I’ll note that SPS appears to late adopter of AI. Management only mentioned AI in a conference call for the first time in July 2023, after the AI parade began. And there was no mentions in other SEC filings until the February 2024 which inserted AI as a risk. Despite that, SPS’ strength of their network and the complexity of services they provide could well insulate them from the disruptive forces of AI. This network, enriched with data and established relationships, offers a strategic moat, potentially enabling SPS to integrate AI enhancements that complement their existing offerings rather than being supplanted by them.
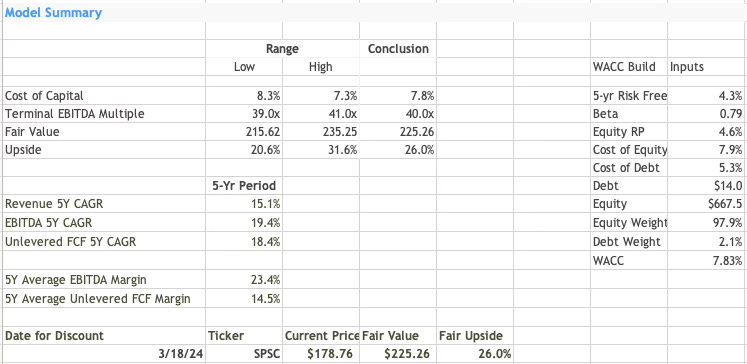
Valuation: To value SPS shares I created a five year DCF model. All five years have revenue projected to grow annually by roughly 15%. SPS is expected to grow slightly more than 15% in 2024 and I don’t see a reason that SPS will grow materially higher or lower than the 15% bar after that. The TAM also allows for plenty of growth for at least five years. I’m also projecting that the EBITDA margin gradually grows as well. The DCF lists reported EBITDA, instead of adjusted EBITDA. The difference has been about 8% in recent years, with the difference largely coming down to SPS removing stock-based compensation (“SBC”). SBC has crept higher as a percent of revenue and SPS will need to moderate as many other technology companies are currently moderating such costs. Assuming SBC margin stops growing, I project the EBITDA margin to be 25% in five years (2028). That would represent adjusted EBITDA of 33%, below the target laid out by management. My revenue growth estimates are ahead of what the Wall Street consensus estimate models and my margin improvement is in-line with consensus.
Other assumptions to calculate free cash flow are as follows: CapEx at about 4.7% of revenue per year, depreciation and amortization at 6.2% of revenue and a pro-forma tax rate of 25%. The other critical assumptions are the cost of capital of 7.8%, which is based on SPS’ five-year beta of 0.79, and current five year risk free rate of 4.25%. I don’t think SPS is any more or less risky than it has been in the past five years so the use of a five-year beta is appropriate. Lastly, I picked an exit multiple of 40X EV/EBITDA (LTM). Together, this calculates a fair value of about $225, which implies 26% upside in the stock price.
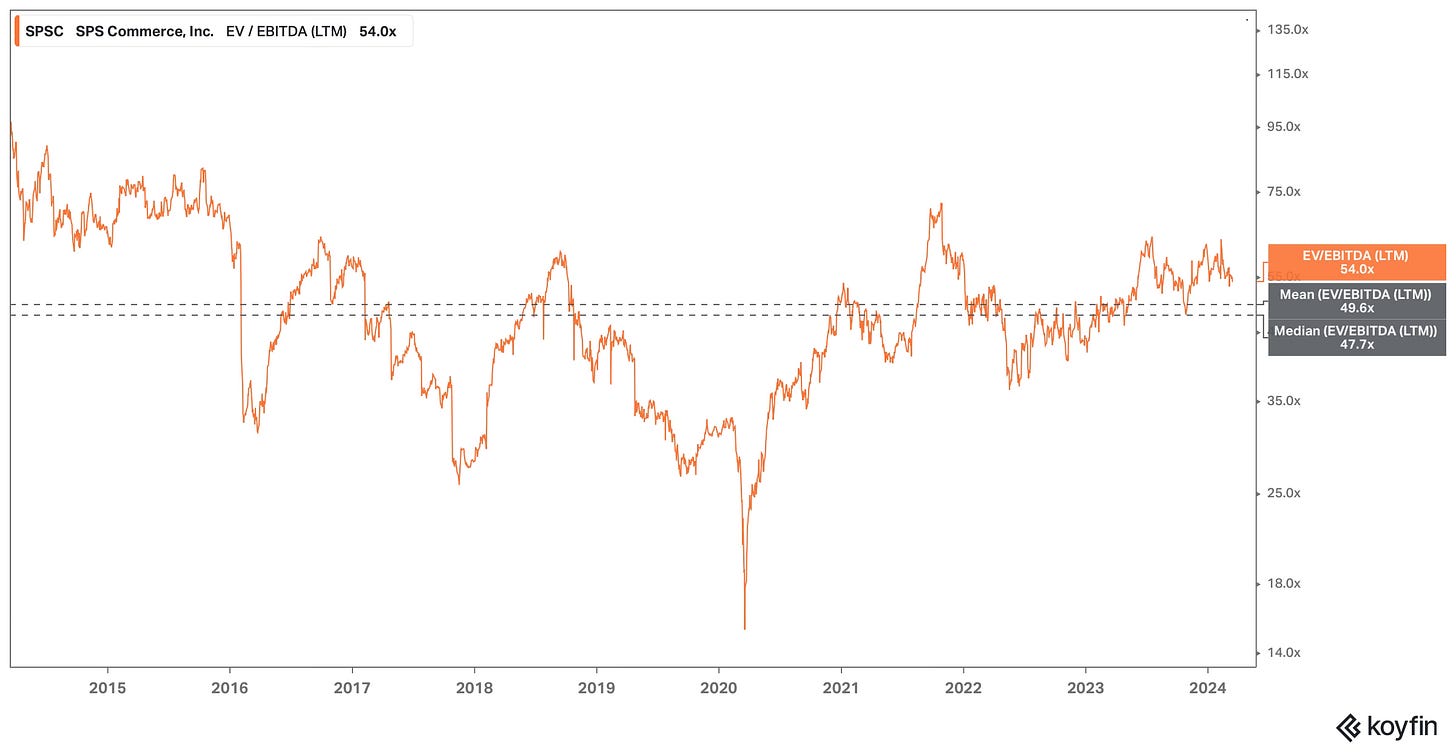
If you’re critical of SPS the input you may question is the exit multiple of 40X EV/EBITDA, which may seem a touch high. However, SPS currently trades at 54X trailing EV/EBITDA and the 10-year average is 49.6. Exiting at 40 therefore is justified based on SPS’ historical trading.
Another data point to justify the 40X EV/EBITDA exit multiple is the current peer comparison. I used Koyfin to screen against technology companies with a past five year revenue CAGR similar to SPSC (10% to 20%) and forward expected growth of 10% to 20%, and this basket of companies also has a 39X EV/EBITDA multiple. When you consider the options here, I don’t mind putting a 40X exit multiple, especially given SPS’ steady growth and available opportunity when comparing the remaining TAM.
Final Thoughts: SPS was a fun and interesting company to analyze. I’m particularly interested in their strong go-to-market strategy that has proven successful. CEO changes do make me a little apprehensive as an investor though Chad Collins is a suitable candidate and will have good support elsewhere on the executive roster, particularly from CFO Nelson. The company has had a history of strong financial and stock performance, and I expect that to continue. 26% upside, according to the DCF model, leaves no margin of safety. I would be an interested buyer into pullbacks, particularly below $160. Regardless, I’ll continue to monitor SPS.
Disclaimer: The content of this report is for informational and research purposes only and should not be construed as financial advice. The views expressed are my own and do not reflect those of my employer. While care has been taken in preparing this report, I make no representations or warranties of any kind regarding its accuracy or completeness. I currently hold no position in any stock mentioned. However, like any financial analyst, my perspectives may carry inherent biases. Readers are encouraged to conduct their own due diligence.






Good deeper dive, but opentext was not the best Peer imho
What about Manhatten or Descartes?