


Zebra Technologies (ZBRA)
After sales drought in 2023, Zebra will return to form with upside again

Overview: Zebra Technologies ZBRA 0.00%↑ is an international leader in the making enterprise assets more intelligent. Essentially, they provide solutions that assist companies in automatically identifying, tracking, and managing their resources. To give you a clearer picture: think about devices like mobile computers, barcode scanners, RFID readers (which are devices that use radio-frequency waves to transfer data from a tag attached to an object, used for tracking and identification), and specialized printers that produce barcode and RFID labels. This technology is under what's known as "Automatic Identification and Data Capture" or AIDC. Instead of a simple labels with barcodes that are manually scanned, RFID chips can be embedded into tags/labels for automatic location tracking through wall-mounted or fixed table scanners.
But Zebra's offerings go far beyond hardware; they produce powerful tools that help businesses meet key goals such as ramping up productivity, adhering to regulatory compliance, and delivering outstanding customer experiences. Imagine a warehouse where every package, each piece of equipment, every worker, robot, and even customers in a store or patients in a hospital, are digitally connected. This level of connectivity gives businesses the power to know the status, condition, location, usage, and even preferences of their assets at any given moment.
Zebra has also been building out its software offerings. Not only do they make and sell a wide range of AIDC products, they also deliver related software applications. And to ensure their customers are never in a bind, they offer a full range of services, including maintenance, technical support, repair, and managed services. They also have cloud-based software subscriptions and robotic automation solutions up their sleeve.
Zebra has been leading a shift from the traditional AIDC market into what they term "Enterprise Asset Intelligence" (EAI). With EAI, Zebra aims to make their solutions sense more, analyze more, and act more effectively throughout their workflows. Think of it like a detective novel where the clues are gathered (sense), pieced together (analyze), and then acted upon to ensure the best outcome (act).

Fueling this evolution is a strong undercurrent of technology trends, including the Internet of Things (IoT), cloud-based data analytics, intelligent automation, mobility, computer vision, and AI and machine learning. Thanks to IoT, Zebra's solutions can connect a growing number of smart devices, allowing for a real-time exchange of a vast array of information. With machine learning and AI, Zebra is stepping beyond mere data collection; they're analyzing it in real-time to provide actionable insights.
Moreover, the expansion of mobile devices and application software is dramatically expanding mobile computing use cases across enterprises and supply chains. This means businesses can access and act upon dynamic data anytime, anywhere. Zebra’s technology is being enhanced by computer and machine vision technology – essentially giving their solutions the ability to "see" and understand digital images or videos that keep them up to date with AI trends and provides another layer of intelligence to their toolset.
Segment Analysis: Let me break down the reportable segments to dive deeper. The first of two segments is Asset Intelligence & Tracking (“AIT”) that includes barcode and card printing, supplies and services. The second is the Enterprise Visibility & Mobility (“EVM”) segment which includes mobile computing, data capture, machine vision, services and workflow optimization solutions. AIT made up 30% of 2022 sales while EVM made up the remaining 70%.
Asset Intelligence & Tracking (“AIT”): Produces high-quality, on-demand printers for labels, wristbands, tickets, receipts, and plastic cards, catering to a multitude of applications requiring data accuracy, speed, and reliability. These printers use thermal technology and support various communication protocols, making it so they can integrate into most computer systems. AIT also includes the production and sales of customized thermal labels, receipts, ribbons, plastic cards, and RFID tags, and provides various maintenance, technical support, and repair services, including cloud-based subscriptions. Zebra has a lot of content on their website and if you want to read more on the products check out their solutions and offerings. It includes brochures on products such as RFID. Of the $1,736M in sales AIT did in 2022, $95M (5.5%) was services and software, indicating nearly all of the segment was tangible products.

Zebra provides segment level results for AIT and EVM. The following table strings together multiple 10-Ks to understand the trends over time for AIT. GAAP net sales and organic sales growth have been solid at a compounded annual growth rate of 5.6% since 2016. Sales lagged in 2020 as customers pushed off purchases, but made up for it with 19% organic growth in 2021. 2022 essentially moderated back to the norm. I’ll also note that margins have deteriorated over time with gross margin bottoming in 2022 at 43.0% and operating margins similarly at a multi-year low of 20.7%.

Enterprise Visibility & Mobility (EVM): manufactures and sells enterprise-grade mobile computing products and accessories for various enterprise applications. These devices support local-area and wide-area voice and data communications and include features like barcode scanning, GPS, RFID, and other sensory capabilities. Specialized features like advanced data capture and analytics technologies further enhance efficiency.
The EVM segment also designs and manufactures barcode scanners, RFID readers, industrial machine vision cameras, and fixed industrial scanners. These scanners are used in diverse applications, from supermarkets to hospitals, and can handle linear and two-dimensional barcodes.
EVM offers comprehensive maintenance, technical support, repair services, and managed and professional services for their customers. It also provides cloud-based subscriptions and workflow optimization solutions, including software-based solutions, retail solutions, and robotic automation solutions. These solutions aim to improve agility and productivity, mainly focusing on frontline workers in core customer segments.
Lastly, their Location Solutions provide precise, real-time information about the location and status of high-value assets, equipment, and personnel, using technologies like RFID and beacons. They cater primarily to manufacturing, aerospace, transportation and logistics, sports, and healthcare industries.
Similar to AIT, the table below provides a breakdown of segment level results for EVM. First starters, EVM has been growing quicker than AIT. In 2022, EVM made up nearly 70% of company-wide sales, up from 65.4% in 2016. The growth in that period was 8.9% annually on an organic basis and 9.6% on a GAAP reported basis. The difference is organic excludes foreign exchange, acquisitions and divestitures. Acquisitions added incrementally to sales for EVM. Unlike AIT, margins have improved since 2016. Gross margins of 46.4% in 2022 is up 2.3% while operating margins are up 7.1%. The last segment note is that EVM has solidly higher revenue stemming from services and software at 19.1% in 2022, which has steadily risen.

It’s important to analyze deconsolidated results to further understand drivers of the business. For Zebra, you can see the largest segment is growing quicker and performing better. The company-wide financial highlights for the past seven years includes an 8.3% compounded annual growth rate (“CAGR”), steady gross margins at 45% and operating margins that have held steady despite some volatility.
As noted while discussing the AIT segment Zebra had relatively poor performance in 2020 as it dealt with poor demand, which was more pronounced in AIT compared to EVM. That was followed by unusually strong growth in 2021 when sales grew 23.2% organically. Zebra said in the 2022 10-K:
Total Net sales increased $1,179 million or 26.5% compared to the prior year primarily due to broad-based customer demand to digitize and automate their businesses. Net sales growth across both of our segments and all of our regions included pent-up demand from customers who we believe had delayed purchases in fiscal 2020 due to the COVID-19 pandemic. In addition, Net sales for the prior year included the negative impacts of supply chain disruptions within our EVM segment resulting from the temporary closure of a key distribution center supplying the Americas late in the first quarter.
You can also see in the following table that gross margins dipped in 2022 while operating margins dropped more substantially that year. The 1.3% drop in gross margins stemmed from higher freight and component costs. The operating margins were dealt a blow due to a litigation that was settled against competitor Honeywell (HON) in which Zebra paid $372M, inclusive of legal fees. If you exclude that, operating margins would’ve been 15.5% instead of 9.2% with the former in-line with recent years.

According to the 10-K, Zebra says it operates in a competitive industry with growth driven by factors such as IoT, cloud computing, automation, and mobility. Key competitive aspects include product quality, price, design, performance, availability, and brand reputation. In mobile computing, rivals include Datalogic, Honeywell (HON), and Panasonic. In data capture and machine vision, they compete against Datalogic, Honeywell, Newland, Impinj (PI), Cognex (CGNX), SICK, and Keyence. In printing, competitors include Fargo Electronics, Honeywell, Sato, Toshiba, TSC, Brother, and Dymo. The supplies and workflow solutions sectors has numerous global competitors.
In discussing competitive strengths, Zebra has a sub-section titled “High barriers to entry”. The title got changed from “High entry and switching barriers” in 2023 which makes you wonder if there’s a difference in switching costs now. The section itself was unchanged in saying:
“On a global basis, we have long-standing relationships with end-users and with our extensive network of channel partners. We believe these customer relationships and our strong partner network are critical to our success and would be difficult for a new market entrant to replicate. We believe a significant portion of our products and solutions are deployed with specialized product performance and software application requirements, which could result in high switching costs.”
Other competitive strengths include commitment to innovation and deep industry-specific expertise, highly diversified business mix, global reach and brand and scale advantages.
I’ll summarize comments from research and advisory firm Gartner. The strengths, according to Gartner, are Zebra’s data-driven, agile platform, rich partner ecosystem of over 10,000 partners, and cloud-ready APIs. The cautions were that products may be considered expensive for small and midsize enterprises, complexity-creating underlay architecture and limited healthcare experience as Zebra focuses on retail, manufacturing and warehouse. Nonetheless, Zebra is a leader in the quadrant for Indoor Location Services.

Zebra primarily sells its products and services via distributors, value-added resellers, independent software vendors, direct marketers, and OEMs, and directly to select customers. Some Zebra products are re-sold by OEMs under their own brands. “These relationships are highly valued and allow our products to reach end users in a wide array of industries around the world,” the company says. “We believe that the breadth of our distributor and channel partner network is a competitive differentiator and enhances our ability to compete.”
There’s three customers that each account for at least 10% of sales, and in each case they’re distributors. Zebra doesn’t detail who they are, simply saying Customer A accounted for 20.7% of sales, Customer B accounted for 15.0% and Customer C accounted for 12.8% of 2022 sales. Because they’re distributors, and not actually end users, the customer concentration isn’t a knock on Zebra when considering Porter’s Five Forces (power of customers being one of them).
Capital Allocation: The two closest peers to Zebra are Honeywell and Datalogic. Honeywell is a more diversified business and the overlap between Zebra comes from Honeywell’s Safety and Productivity Solutions segments, specifically Production Solutions and Services, and Warehouse and Workflow Solutions. Those two sub-segments made up $3.96B of $35.45B in sales in 2022 (11.1% of company-wide sales). Nonetheless, it’s helpful to analyze capital allocation — the ways companies spend their money — and compare against another peer. While Datalogic is a close peer to Zebra, for this analysis, I've chosen to compare Zebra to Honeywell because Honeywell is a U.S.-based company, making for a cleaner data comparison as opposed to Datalogic.
Looking back since 2013, Zebra has generated $5.4B in cash from operations, and 11.7% of that went toward capital expenditures, 21.3% went toward buybacks and 106.0% was spent on acquisitions (net of divestitures). Judging by those figures, management has opted to grow the company through M&A. However, most of that M&A value came from a single transaction in 2014. Zebra spent $3.45B to acquire the enterprise business of Motorola in order to offer and end-to-end solution through mobile computing and data capture. The deal caused Zebra’s leverage ratio (debt/EBITDA) to balloon to 9X as it was basically funded through a major debt offering. It ended up paying off for Zebra seeing as FCF per share accelerated higher in the years after and I’ll note the leverage ratio has been normalized at a more comfortable 2X and under since 2019. If you only looked at M&A spend since 2015 it would equal 44.5% of cash flow from operations.
Honeywell has generated $57.3B in cash from operations since 2013. 16.5% was spent on capital expenditures, buybacks made up 49.9% of the spend, M&A was at 18.7% and dividend spend was 37.2%. Comparing the two, Honeywell has clearly been focused on returning capital to shareholders via relatively high buybacks and dividends, especially considering Zebra hasn’t paid a dividend. Zebra management has been vocal about favoring internal growth and external growth via M&A in similar markets and venture investments through Zebra Ventures, an interesting VC investing arm with a website that discusses strategy.
Capital allocation priorities have paid off well for shareholders with FCF per share up 9.8% compounded annually through 2022. That would’ve been 13.7% had it not been for the legal settlement against Honeywell I noted above when discussing operating margins. Of the $372M settlement, $147M was paid in 2022. The full amount will be paid by Q1’24 so FCF will again take a hit this year.

A couple notes beyond the table of data. For starters, Zebra appears more thoughtful with buybacks and has rarely been in the market. Part of that stems from the high debt load post-Motorola acquisition. It’s also because management has been opportunistic by leaning into weakness. Honeywell buys back quite frequently and isn’t opportunistic with execution. The second note in the domain of capital allocation is that spending on CapEx isn’t perfectly comparable. Zebra’s organic investment via CapEx appears low from the cash flow statement. The company includes a subsection within the business description of the 10-K for Research and Development.
The Company devotes significant resources to developing innovative solutions for our target markets and ensuring that our products, solutions, and services maintain high levels of reliability and provide value to end-users. Research and development expenditures for the years ended 2022, 2021, and 2020 were $570 million, $567 million, and $453 million, or 9.9%, 10.1% and 10.2% of Net sales, respectively. Worldwide, we have employed approximately 3,100 engineers and innovation and design experts, who along with contractors, are focused on strengthening and broadening our extensive portfolio of products and solutions.
Looking at Honeywell, the company directed about 4.0% of its revenue towards research and development over the past three years. However, understanding the nuances between CapEx and R&D spend is important when comparing these figures with Zebra's numbers.
CapEx mainly comprises investments made towards tangible assets that sustain or grow a business - think of machinery upgrades or additions in factories. The outlays here are concrete, quantifiable, and thus, comfortably nestled under the CapEx banner on financial statements.
On the flip side, R&D expenditure can be more elusive, and its direct translation into future revenue is often less certain. It encompasses spending on less tangible assets, such as investment in emerging technologies, which often involves costs like engineer salaries. While not as easily measurable as CapEx, these investments are crucial to a tech-oriented firm like Zebra, as they fuel innovation and drive future growth.
By considering this aspect, Zebra's commitment to internal growth becomes more evident. Despite the seemingly modest CapEx numbers, the company's substantial R&D investments show a clear strategic focus on enhancing its tech prowess and expanding its solution offerings. This underscores the importance of viewing CapEx and R&D not as separate line items, but as a combined measure of a company's overall investment in growth and future sustainability.
Management and Incentives: Bill Burns, 54, has been CEO of Zebra since his promotion from chief product and solutions officer in March 2023. Burns joined Zebra in 2015 as SVP, Enterprise Visibility and Mobility (EVM Segment) and chief technology officer. Despite being promoted from within, Burns has held two other CEO roles. He was CEO of data center network services start-up Embrane which was sold to Cisco (CSCO) in 2015. From 2008 - 2013 Burns was CEO of Spirent Communications (LSE: SPT), a London-based publicly traded company. So Burns took over as CEO of Zebra from Anders Gustafsson. Oddly enough, Burns also took over as CEO of Spirent from Gustafsson as he was CEO there from 2004-2007.
While Burns was chief product and solutions officer, he was the second highest-paid executive behind then-CEO Anders Gustafsson, so it’s clearly an important role for Zebra. Joe White was promoted and replaced Burns as chief product and solutions officer, after having served as SVP and GM of enterprise mobile computing. White joined Zebra through the acquisition of Motorola Solutions in 2014.
Nathan Winters, 41, joined Zebra as VP of corporate FP&A then took on the CFO role on an interim basis August 2020 before being named permanent CFO in January 2021. Winters’ career was spent at General Electric (GE) and GE Healthcare (GEHC) where his most recent title was CFO, Global Supply Chain from 2016 - 2018.
The last position I’ll note on the executive roster is Chief Revenue Officer Joachim Heel. Heel has led sales for Zebra since joining in 2014 but changed title to CRO in 2021. Previously, he was VP of enterprise sales at IBM (IBM). Overall, the roster at Zebra feels stable by routinely promoting from within. It’s a nice attribute considering the strong returns over the past decade.
Compensation: Zebra targets that executives base salaries make up ~17% of their total compensation and 8.1% for the CEO role. Short-term incentive compensation (regularly known as cash bonus) makes up 16% of executive compensation while the CEO is again lower at 10.9%. The largest form of compensation is long-term incentive compensation (stock awards) with the CEO at 81% and other executives at 67.1%. The percentage break-down is fairly standard for a technology company and aligns compensation with shareholder value by leaning into stock-based compensation.

The following table shows the dollar value of compensation paid to executives, according to the March 2023 proxy. Gustafsson remained as CEO through March 1 so he was still included in the summary table. Overall, the payouts align with the elements visualized above.

Annual short-term incentive compensation is weighted 30% to net sales, 50% to adjusted EBITDA (dollar value) and 20% Enterprise Asset Intelligence (“EAI”) Index. Those weights have been in place since 2019, the year Zebra introduced the EAI Index component.
The 2023 proxy says the EAI Index sales is “defined as a measure of Zebra's sales of EAI offerings and is based on sales of specific EAI-related solutions”. That isn’t very clear. However, if you go back and look at proxies from 2019 - 2021, there’s a bit more color. EAI Index is “defined as a measure of Zebra's sales of EAI offerings and is based on sales of specific EAI-related solutions, such as SmartLens®, SmartPack™, SmartCount®, Zebra MotionWorks®, Warehouse, Location Solutions and managed services, such as VisibilityIQ™.” Generally these products fit into Zebra’s Intelligent Edge Solutions. In 2022, the EAI Index products made $375M in sales (6.5% of total sales), which follows $283.3M in 2021 for 32% growth. This is while company-wide growth was 2.7%. The 2021 sales growth of EAI Index was 75%, again much stronger than company-wide growth. This indicates management is being incentivized to focus more on a currently small portion of sales that’s growing much stronger than the base and could be a great benefit to Zebra in the longer-term.
Long-term incentive compensation is 40% time-based restricted stock units (“RSUs”) and 60% performance-based stock units (“PSUs”). If you’re unfamiliar, RSUs simply vest while employed and don’t have further metrics involved. At Zebra, PSUs are earned based on a three-year performance period and cliff vests at the end of the three-year period. The performance attributes are 60% weighted toward compound average growth (“CAGR”) in net sales and 40% weighted toward adjusted earnings before interest, taxes, depreciation and amortization (“EBITDA”) margin.
“The Named Executive Officers may earn shares based on Zebra's results for each of the three years in the performance period, or based on Zebra's results as of the end of the performance period, whichever is greater.” That gives more flexibility for executives to achieve the targets through the banking system. Any single year Zebra attains performance, executives earn the PSUs. They can also earn it based on the CAGR amount. So it’s a quasi-three-year measurement period.
I like the construction of the long-term incentive pay by leaning heavily on sales growth while keeping margins in mind at a lower weight. However, the hurdles should be higher. I strung together the last four proxy filings to show that the compensation committee has been selecting sales CAGR rates around 4.0% each year. Zebra has easily beaten that figure and the adjusted EBITDA margin percent targets. Therefore actual payout of performance-based compensation has been high, frequently paid out at nearly 200% (the maximum). The table below shows the target sales CAGR and EBITDA margin goals.

Disclosures in proxies about compensation are almost always backward looking. According to some conference call commentary, the goals for incentive compensation changed in 2023 to include some sort of metric for free cash flow conversion (converting net income into free cash flow). Winters said in the May earnings call “We believe the actions we are taking will enable us to deliver greater than 100% free cash flow conversion as we normalize inventory levels. We are focused on achieving a 100% conversion over a cycle, which is now included in our long-term executive incentive compensation plan.”
Outlook: Zebra’s products are costly and aimed toward large enterprises. Hence it takes a lot of planning to purchase equipment and there’s a long sales cycle. Growth began to slow in Q3’22 when Zebra reported its first quarterly YoY contraction in 2.5 years when Zebra reported a sales decline of 3%. At the time, it appeared supply chain was to blame. “We were unable to fulfill all orders due to supply chain challenges related to persistent component shortages for certain products as well as disruption in the transition to our new North American distribution center in the Chicago area. These challenges led to lower throughput than planned late in the quarter,” said Anders Gustafsson in the November 2022 earnings call. “This, along with orders from some large customers being deferred contributed to the lower-than-expected results.” That was the first time the phrase “deferral” was used in a conference call since 2020 amid COVID-19 challenges and it was fairly questioned by analysts that quarter. It was a surprise negative print considering management had expected 3% growth that quarter. Zebra management guided a flat Q4’22, citing macroeconomic uncertainty, elongated sales cycles and project deferrals. Sales beat expectations in Q4’22. However, guidance for 2023 was at a midpoint of -1% when Zebra initially issued FY23 guidance in February. The graphic below shows the year-over-year percent change in quarterly sales growth.

When Zebra delivered financial results for Q1’23 in early May, the company reduced full 2023 sales growth guidance to -4% (midpoint), or down 3% from the prior guidance issued. That includes a 50 basis point headwind from foreign currency changes (“FX”). At the time, adjusted EBITDA margin for 2023 was expected to be 22%, slightly higher than the 2022 mark of 21.4%. Cash flow for 2023 was expected to be $500M at the time which includes $180M in planned legal settlement payments to Honeywell.
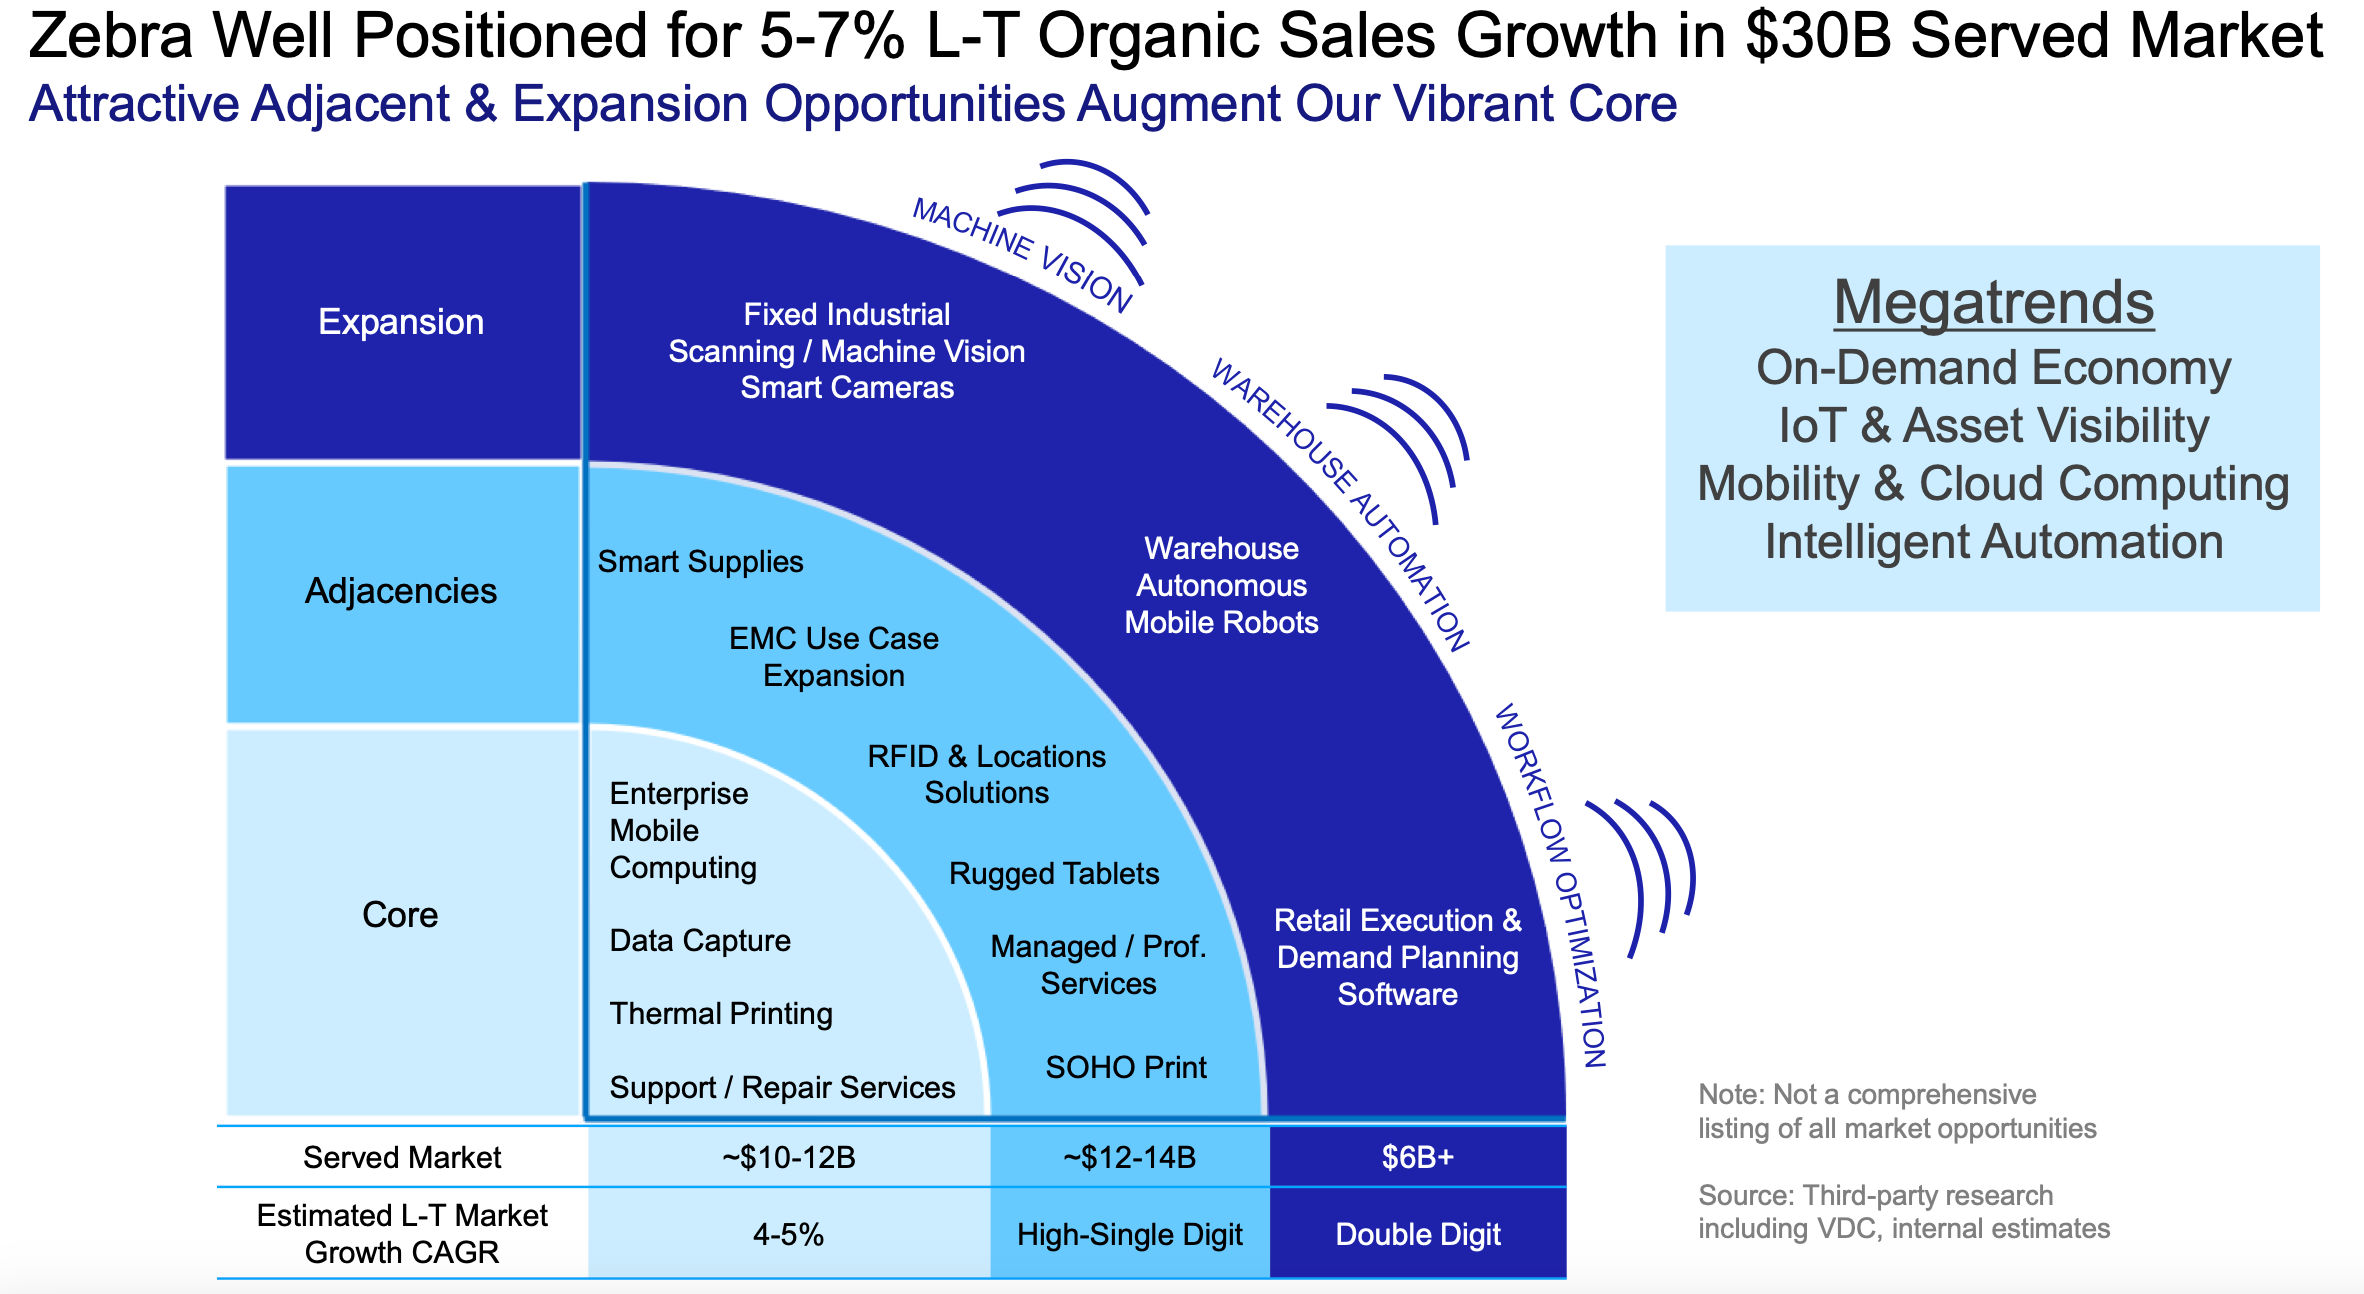
Thinking longer-term, my view is that Zebra returns to form in 2024 and beyond with growth around 7.0%. When I shared the consolidated financial results earlier, it showed Zebra had organic growth of 7.8% since 2017. And that’s a level management is targeting long-term as well. The following is a quote from CEO Burns in the February earnings call and was supported with the graphic below.
The fundamental drivers of our business remain intact. Mega trends, including the on-demand economy, asset visibility, mobility and cloud computing and intelligent automation, provides secular tailwinds for our business. I am proud of the progress we're making in elevating our strategic relationship with our customers. We continue to extend our leadership position in our core business and are gaining traction in adjacent and expansion markets, which have higher growth profiles…I believe we're well positioned to deliver 5% to 7% organic growth over a cycle, with an increasing attractive margin profile as we drive continued traction across our core, adjacent and expansion markets.
The ability to grow at a compound rate of 7% isn’t easy for a company as old as Zebra, especially since they have high market share in their core product base. In order to grow at rates above 4% in the longer-term, it takes high investment in R&D, and that’s what Zebra has done. On June 1, CEO Burns participated in a conference hosted by Sanford Bernstein. He had a couple good quotes that highlight Zebra’s ability to grow in adjacent and expansionary markets.
So think of rugged tablet. I go back 4, 5 years ago, we had no real tablet, rugged tablet portfolio even though we had mobile devices. People wanted to use larger screens. Think of a manager in a retail store, think of somebody doing dock walks inside T&L, they want a larger screen format. We just didn't have a portfolio there…Now we're the leader in rugged tablets. So if we put our mind to something, we can go win share in those markets. They grow at high single digits. So think of RFID technology, think of rugged tablets, optic scanning is in other markets. So flatbed scanning, you see in supermarkets. We weren't in that market at all 7 years ago. Now we're the market leader.
Burns went on to discuss opportunity in adjacent markets and expansionary markets, particularly machine vision, fixed industrial scanning, retail software and autonomous mobile robots. Some of that expansion has and will come from M&A, like the acquisition of machine vision company Matrox in 2022 for $881M and robotics company Fetch for $301M in 2021. Fetch was initially invested in through Zebra’s VC arm which is an intriguing aspect of their M&A reach.
Another conference call quote that caught my ear was the shortening of the replacement cycle for Zebra products. Previously the replacement cycle was roughly five years. An analyst asked in the May earnings call, “coming out of COVID, you put in a ton of assets. And I'm just curious on thoughts on the replacement cycle of that.” Chief Revenue Officer Joachim Heel responded that it’s shortened to three years, implying Zebra could have higher than expected sales in 2024/2025. Here’s the full quote.
The investments we've made over the last few years in customer success have given us a really good insight as to what our installed base is and how our customers are using it. And that has generally revealed to us that the usage cycles have shortened, and that the replacements that are being contemplated now are things that have gone in approximately 3 years ago or even less than that. And of course, we have just launched a brand-new set of our midrange and high-end mobile computers and the value tier was released last year. So those are coming right into that refresh cycle that we're seeing from those customers. And that's another reason why we're quite confident that while these customers are deferring decisions and deployments as we speak, they will have to purchase shortly.
The note about “increasing attractive margin profile“ by Burns stems from the fact that Zebra is finishing up a cycle in which there was higher supply chain cost. Freight costs have been interesting to track, particularly with how much Zebra has paid to ship in the air instead of slowly in ocean freight. The graphic below of excess supply chain costs has been continuously updated in earnings releases. CFO Winters said in the May earnings call.
During the peak of the pandemic or during the peak of the supply chain challenges, we air-shipped all of our printers where historically, we'd ship 80% of those on ocean. So getting that back on ocean is we're on the path of that. And Q2 will deliver about 40% to 60% on ocean.

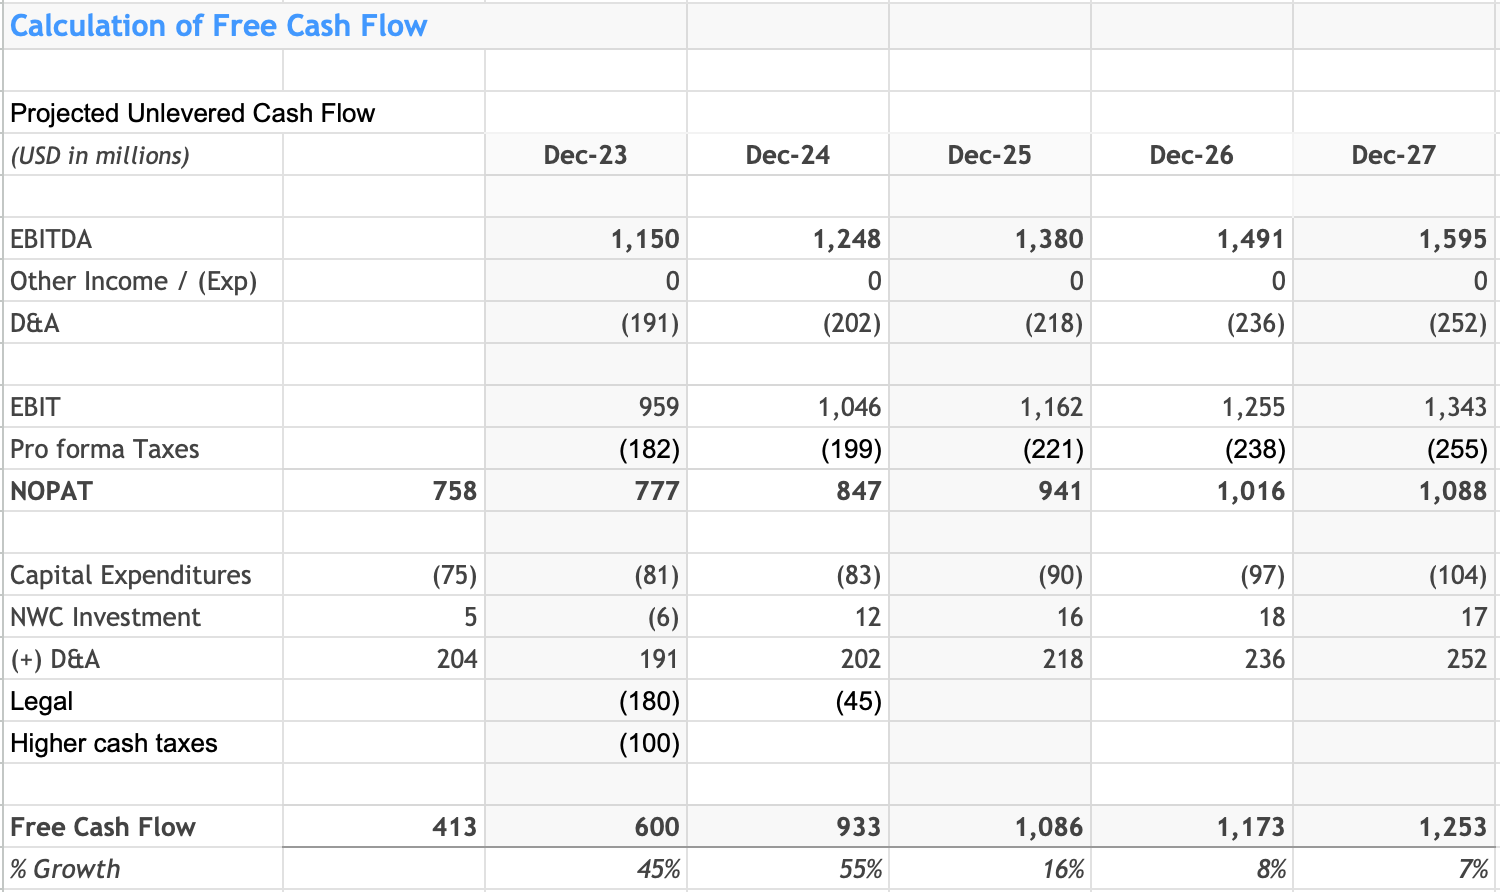
Valuation: My DCF model starts with 2023 revenue dropping -3%, slightly better than management’s guidance. This is a company that under-promises and over-delivers. EBITDA margin of 20.5% matches the guidance. Keep in mind Zebra gives adjusted EBITDA guidance that removes stock-based compensation which often makes up around 1.5% of revenue. I expect growth to gradually return to the norm of 7% over the following five years and margins to tick slightly higher. I’ll note that my forecast is slightly higher than the Wall Street Consensus numbers that see 2025 revenue at $6.21B.

The build-up to the annual cash flow numbers include the following relevant data points. CapEx at 1.4% of sales annually, depreciation & amortization at 3.4% of sales and a tax-rate at 19% (according to Zebra guidance). I also further reduced 2023 FCF due to “higher cash taxes” this year that are “a bit of a burden”, as CFO Winters said in May.
The other important inputs are the discount rate and exit multiple. The discount is calculated as 10.5% based on a beta of 1.7, an equity risk premium of 5.9% and a debt-to-equity ratio of 79%. I chose a 16.5X trailing twelve month (“TTM”) EBITDA exit multiple which matches the average since 2016. For another reference, I screened on peers in the same electronic equipment industry with similar size and five-year sales growth. The 16-company basket trades at 16.4X right now according to Koyfin. Zebra currently trades at 12.7X, which is on the low side of history. DCF summary shows a fair value of $359.
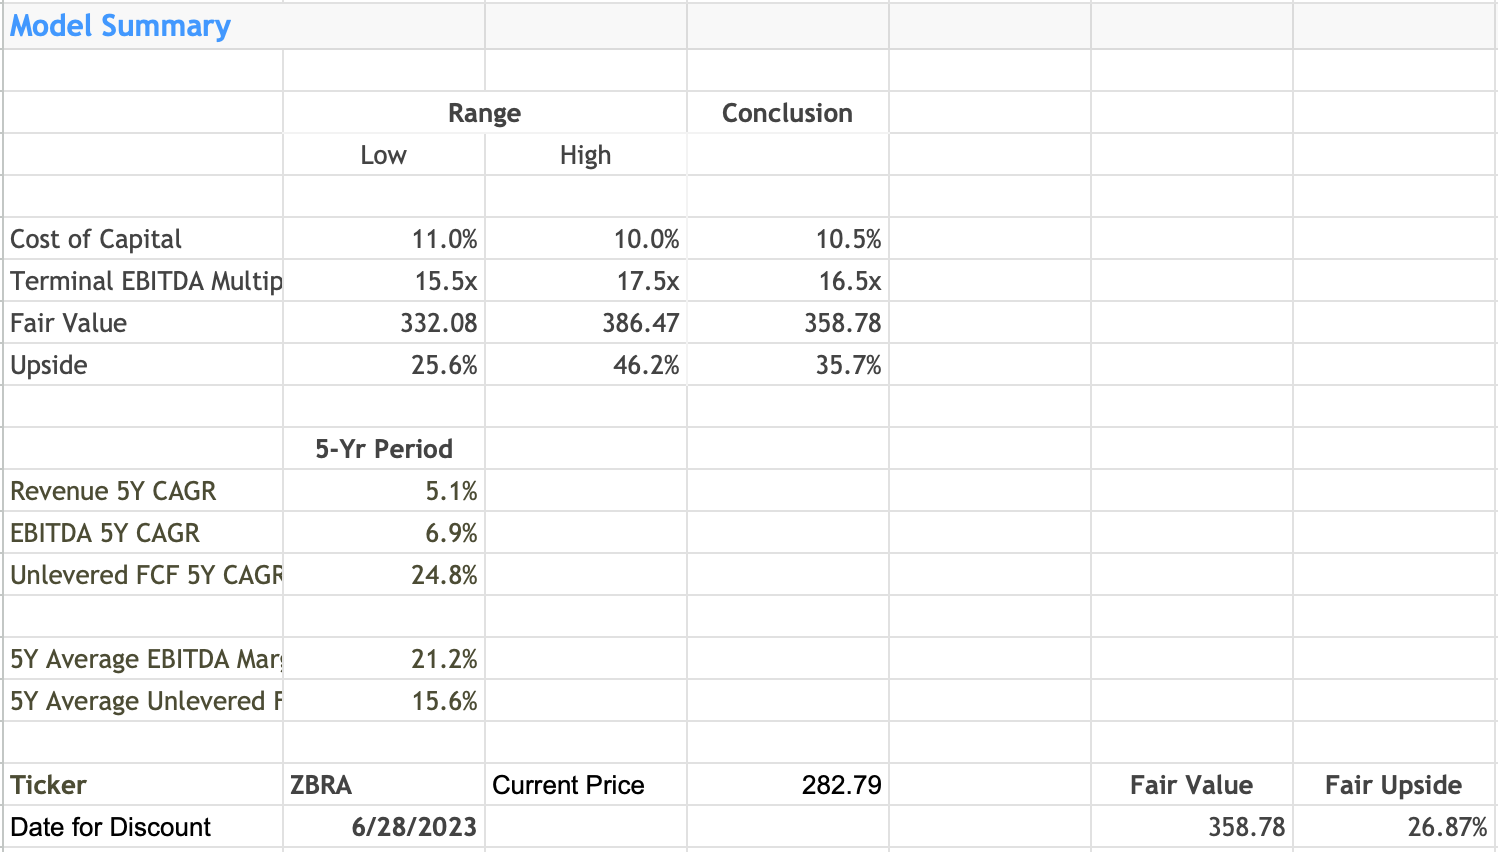
Summary: Zebra provides a good value-proposition to customers with solid tailwinds, such as modern asset tracking and visibility, intelligent automation and optimizing labor through technology. The business has grown well in the past seven years with organic sales growth near 8% and free cash flow had a great trajectory until 2022. The DCF model’s fair value estimate of $359 implies upside of ~27%. This is a stock that will be on my radar, but I prefer a bit more margin of safety. It could look appealing at $255, which would imply upside of ~40%. Long-term I expect free cash flow to compound nicely through the organic investments Zebra makes annually.
Disclaimer: This is not advice to buy, sell or hold any stock referenced. Do your own due diligence. I have no position in any stock mentioned in this report. Like any financial analyst, doesn’t mean I’m not biased.